
Skip to content

Strike Money

A trader’s analytics desk, redesigned for a phone

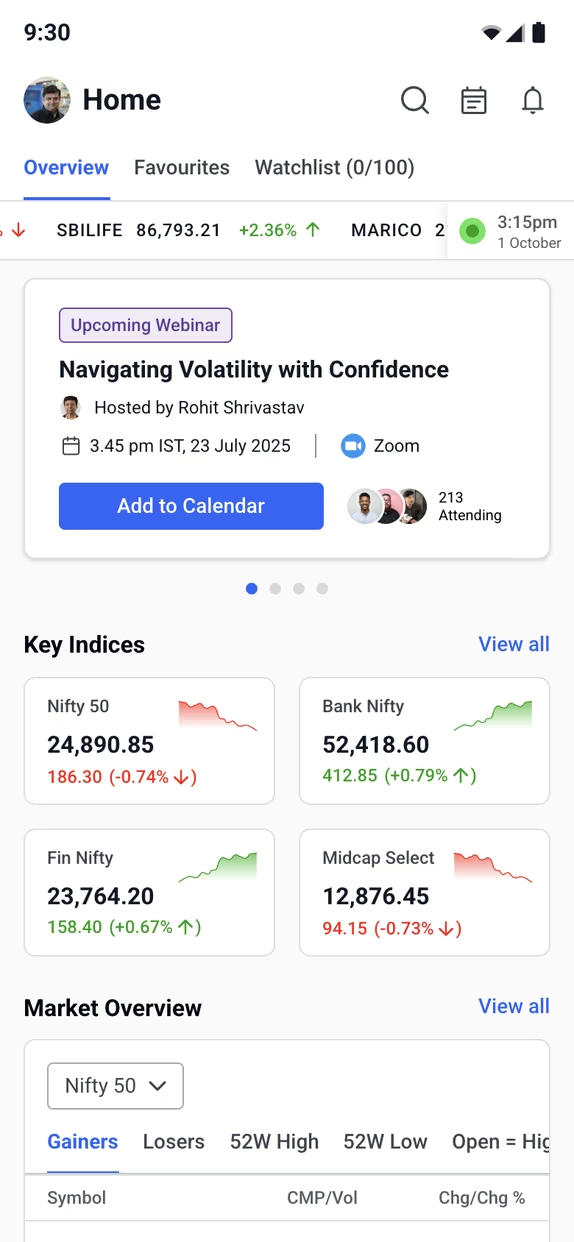
  • Strike's Home screen with index cards and today's webinar
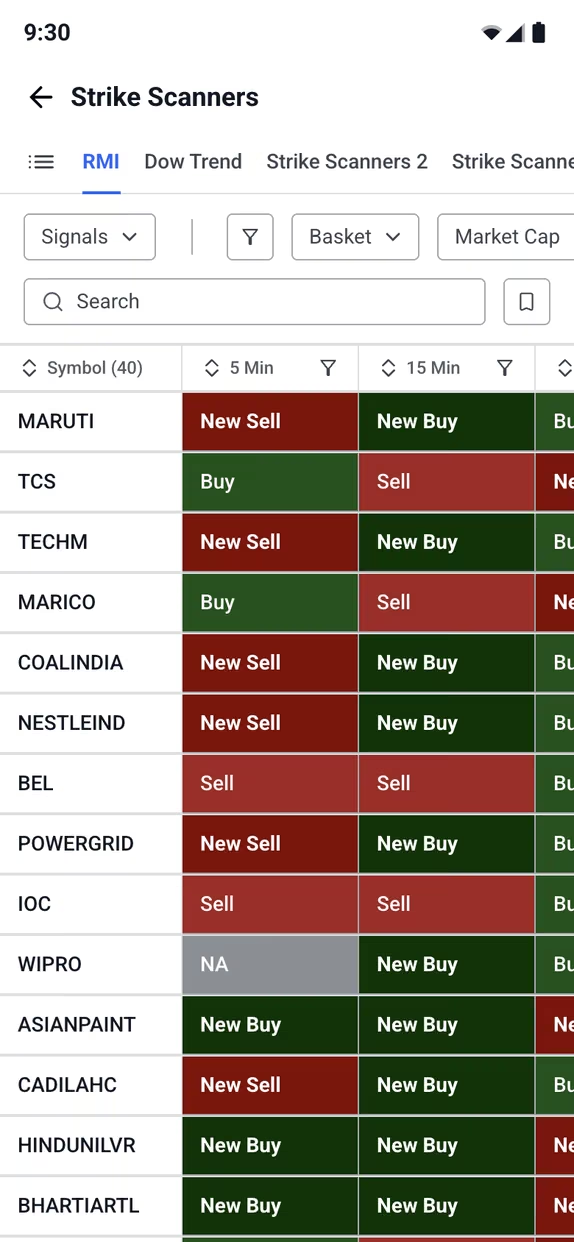
  • A scanner signal grid of stocks against timeframes
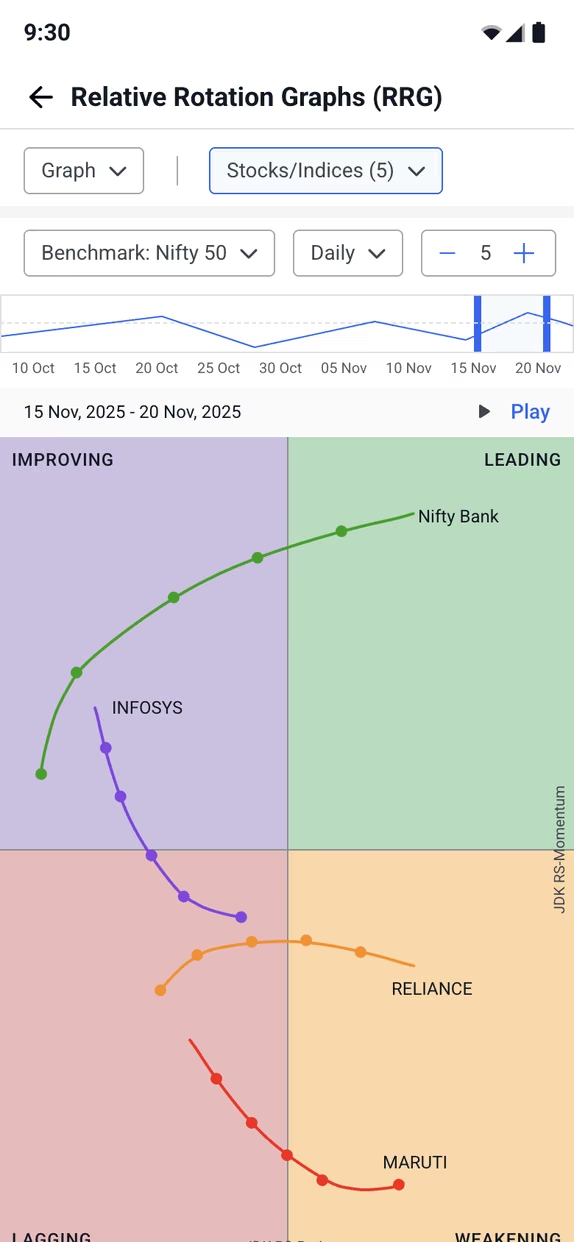
  • A relative rotation graph with four quadrants

Project in few words

Strike gives Indian retail traders market analytics and SEBI-registered research calls: scanners, F&O data, FII/DII flows, relative-rotation charts, IPOs and a market calendar. It all started on the web, built for wide screens. Strike hired me to give it a real mobile app, one where a trader can read the market, act on a research call and learn the tools from a 390px phone.

Case study coming soon
Project Scope
Mobile App Design, iOS + Android
Business Model
B2C
Client
Strike Money

Screens

Market overview

Strike's Home screen: index cards, an upcoming webinar, then market breadth, FII and DII flows and F&O activity further down
HomeIndices and today’s webinar up top, then breadth, institutional flows and F&O activity
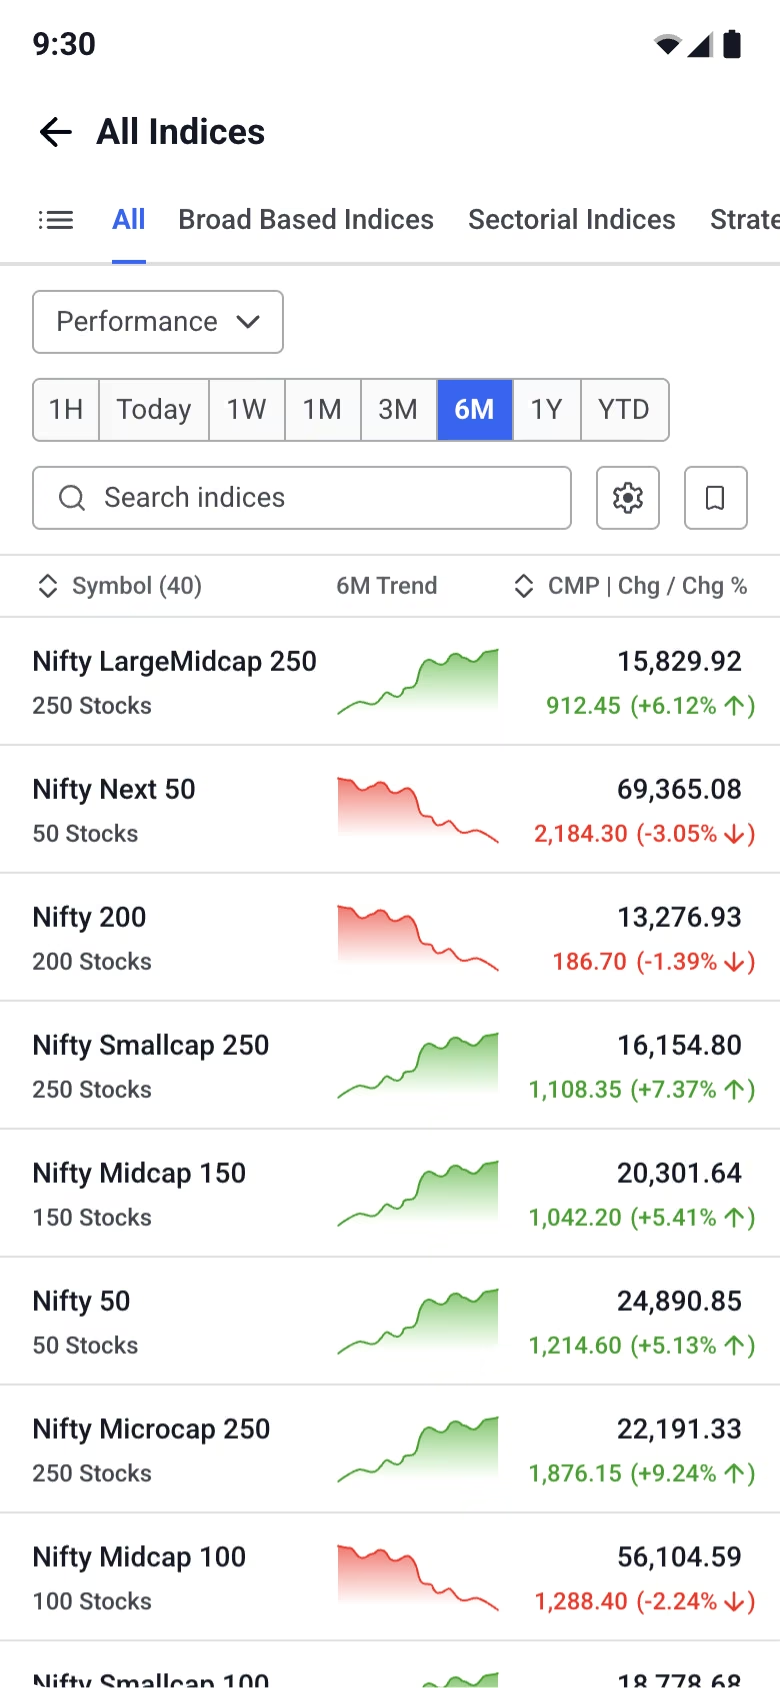
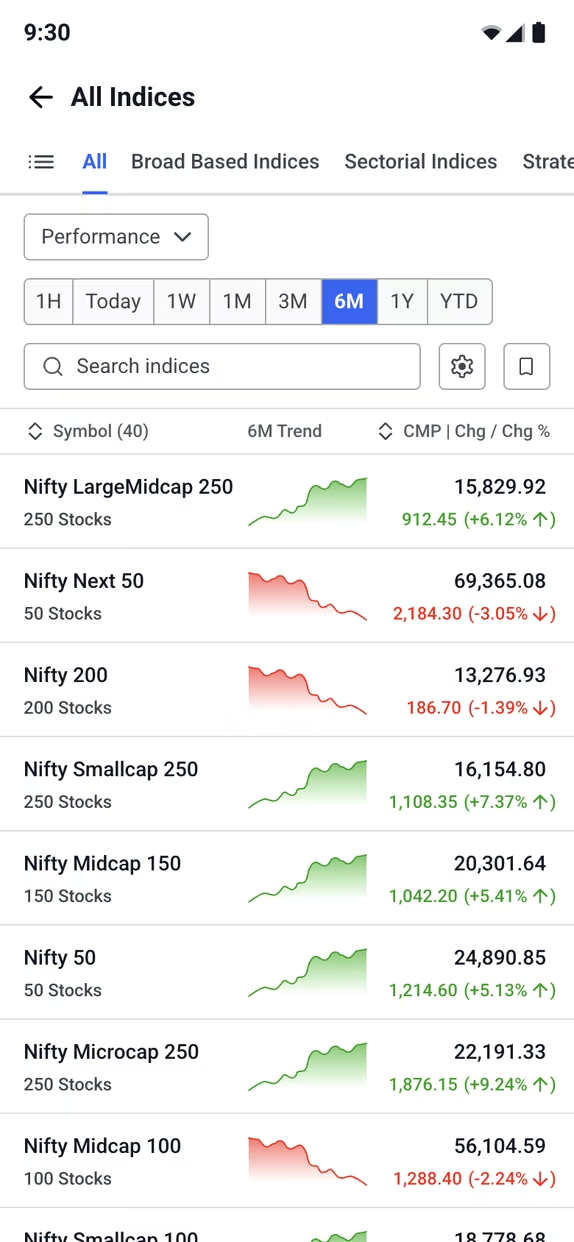
A list of every NSE index with its price, day change and a six-month sparkline
All indicesSix-month sparkline on every row
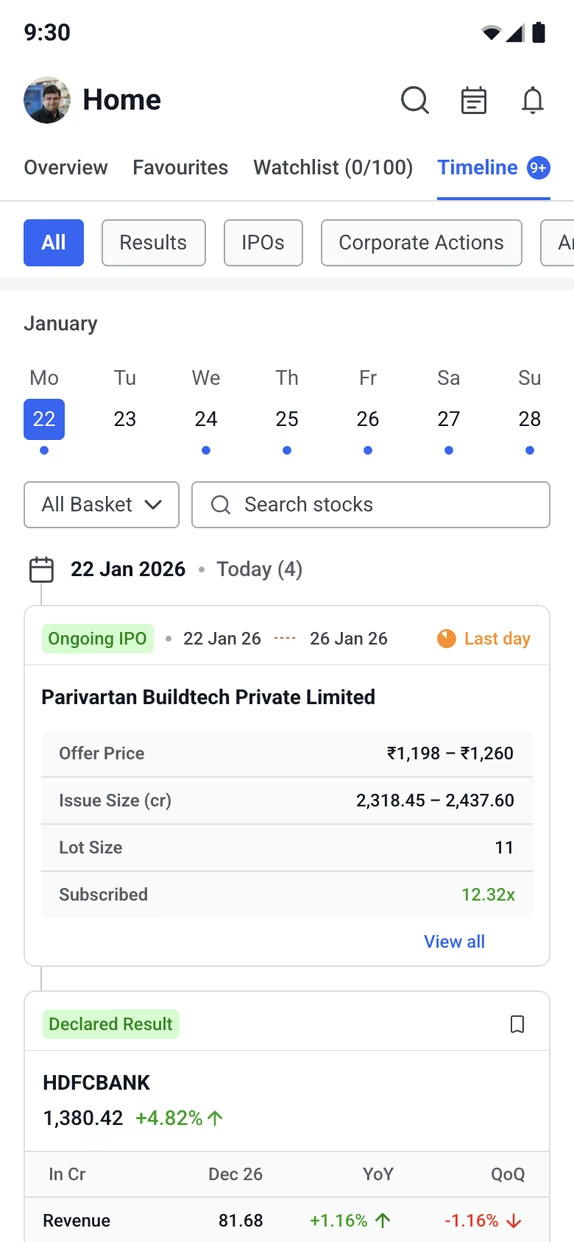
The Timeline tab: a week strip of dates above cards for results, IPOs and corporate actions
TimelineResults, IPOs and corporate actions by day, each event type on its own card
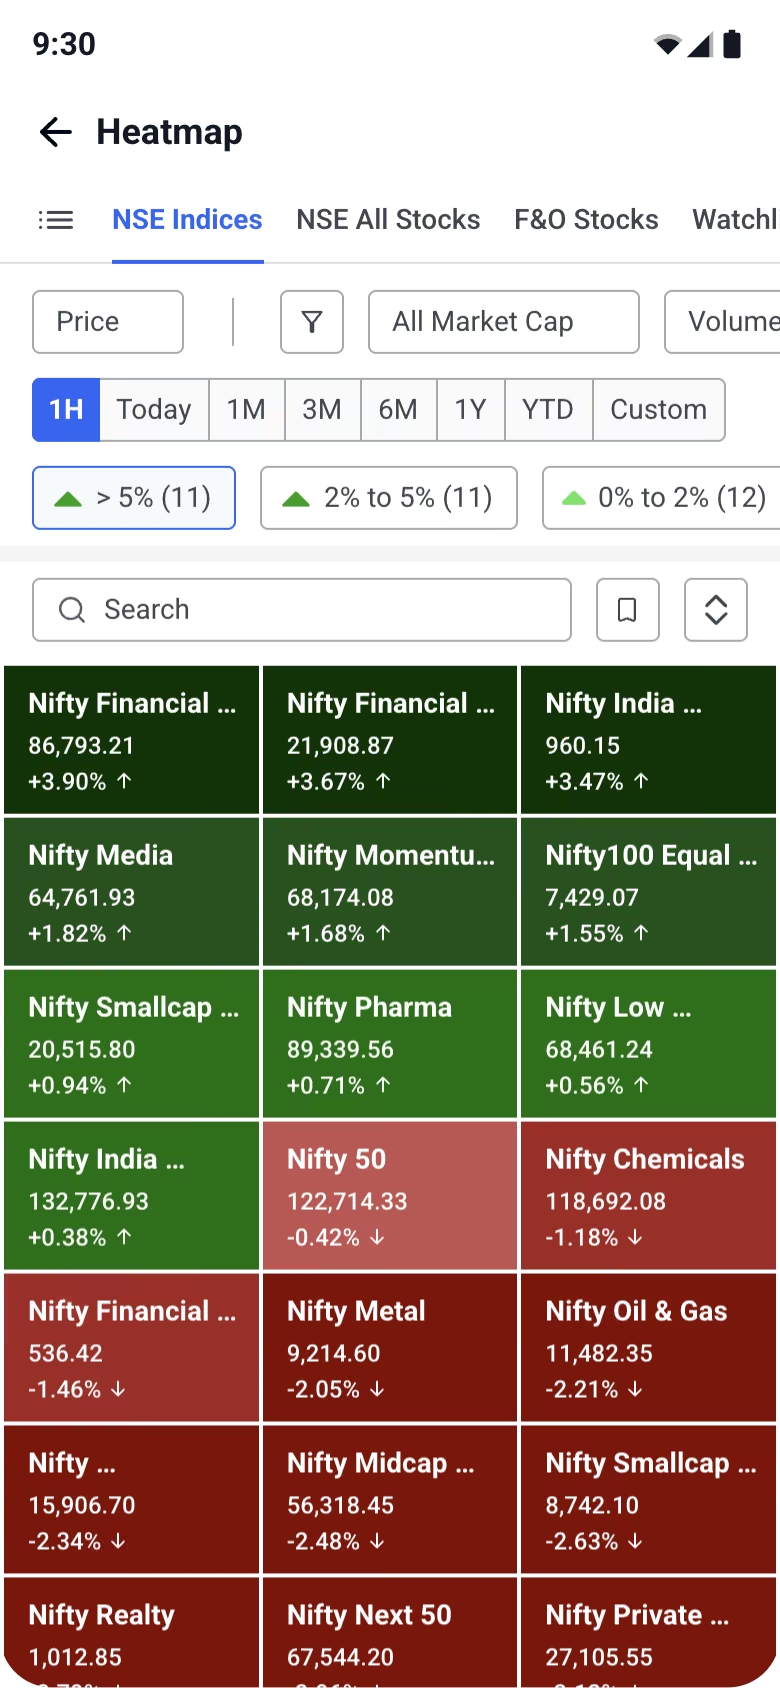
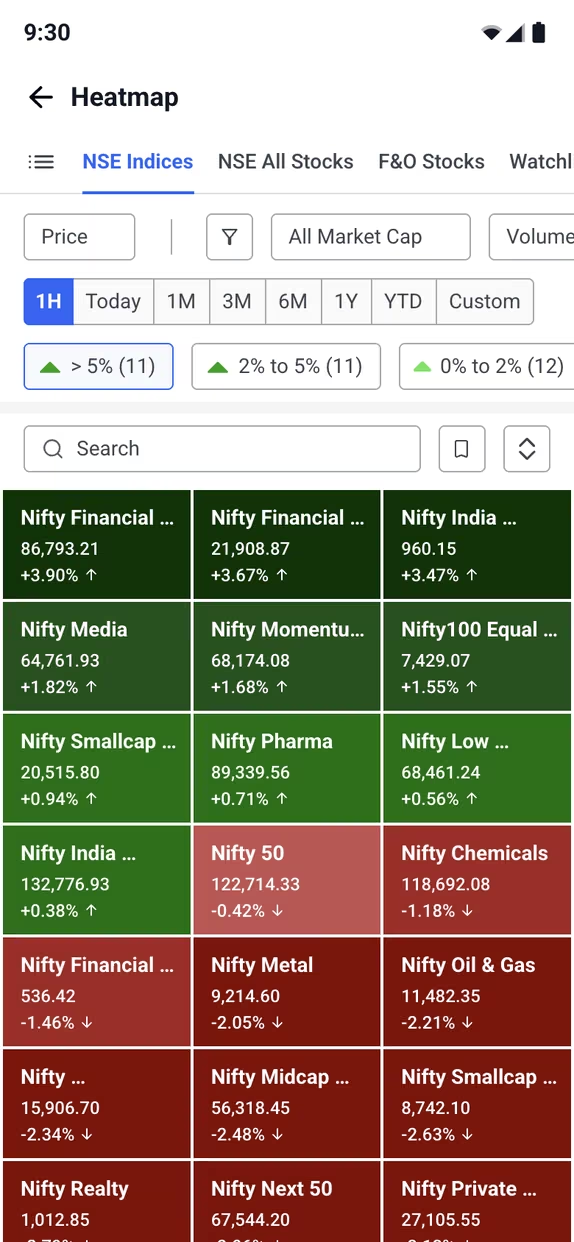
A heatmap of NSE indices, each tile shaded green or red by its move
HeatmapEvery index, coloured by the day’s move

Stocks

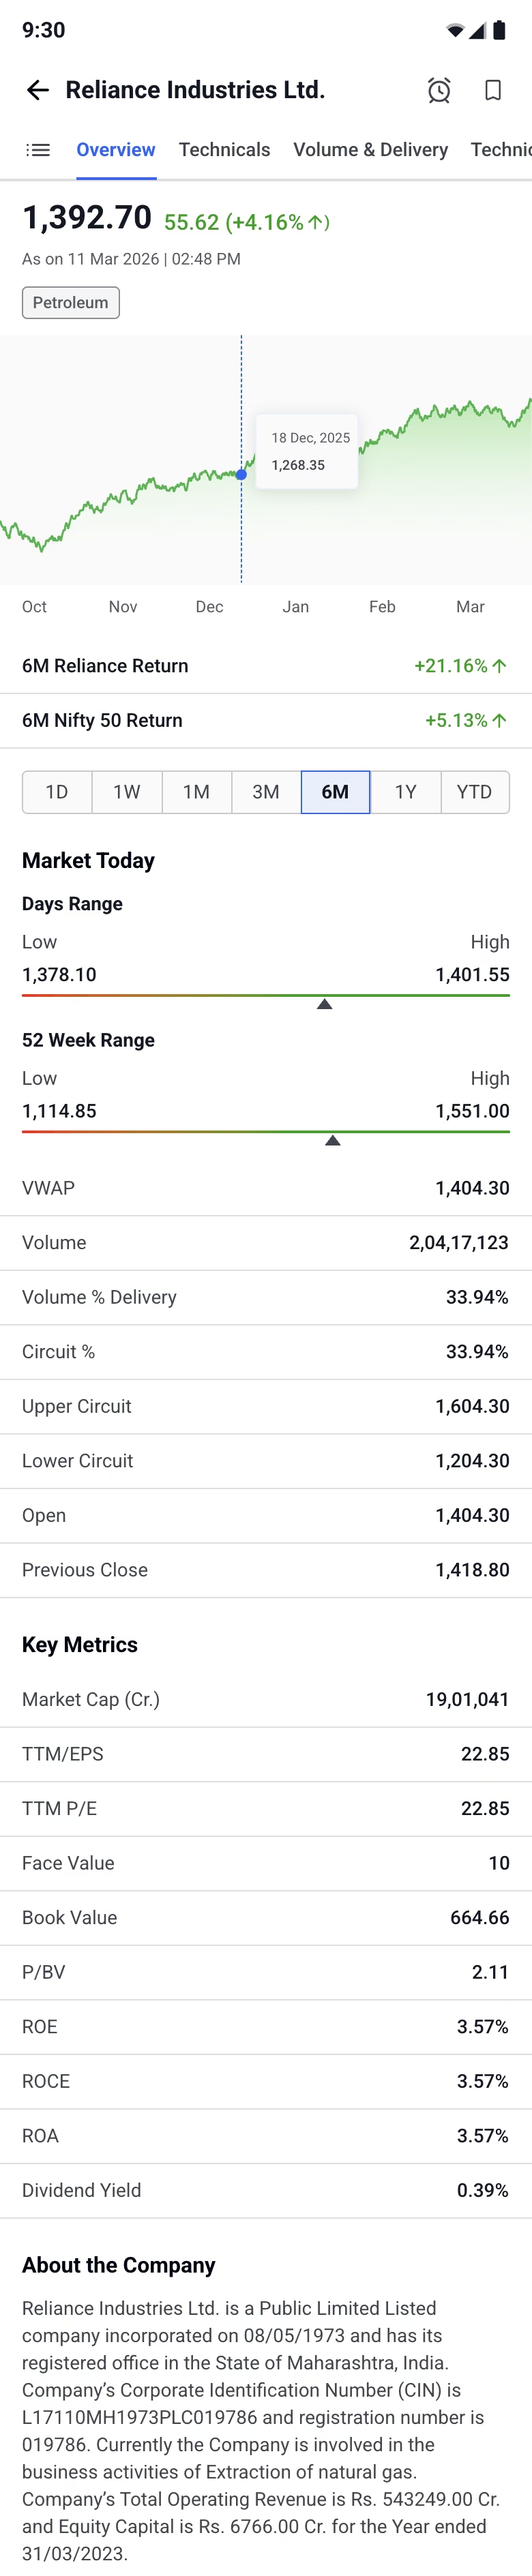
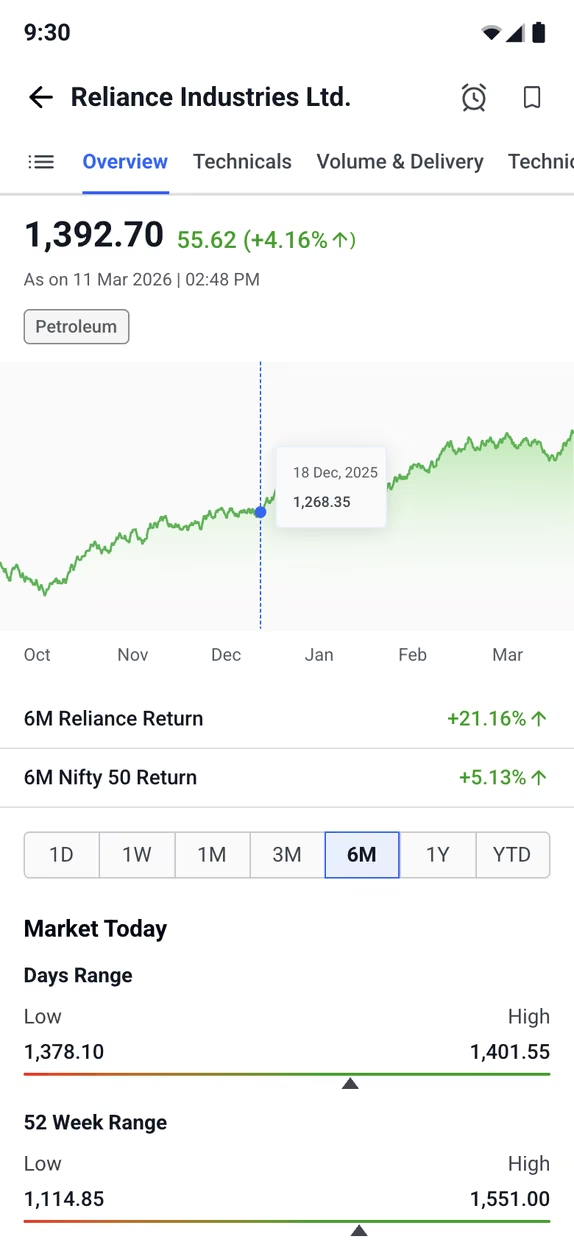
A stock page for Reliance Industries: price chart, returns against Nifty, day and 52-week ranges and key metrics
Stock overviewPrice, returns against Nifty, day and 52-week range, then key metrics
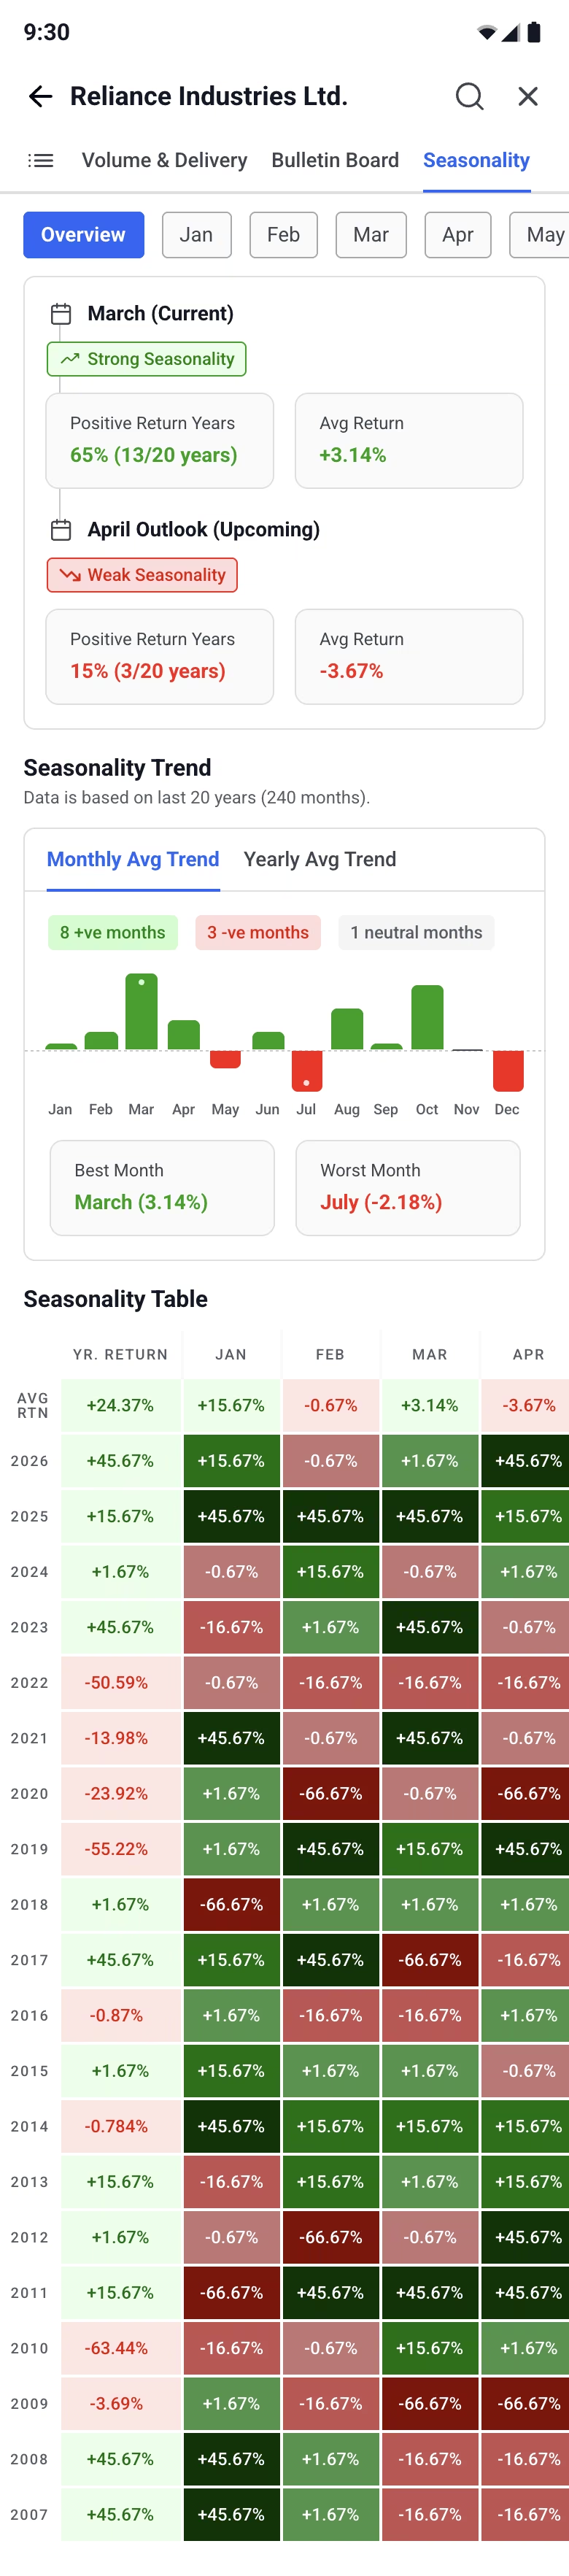
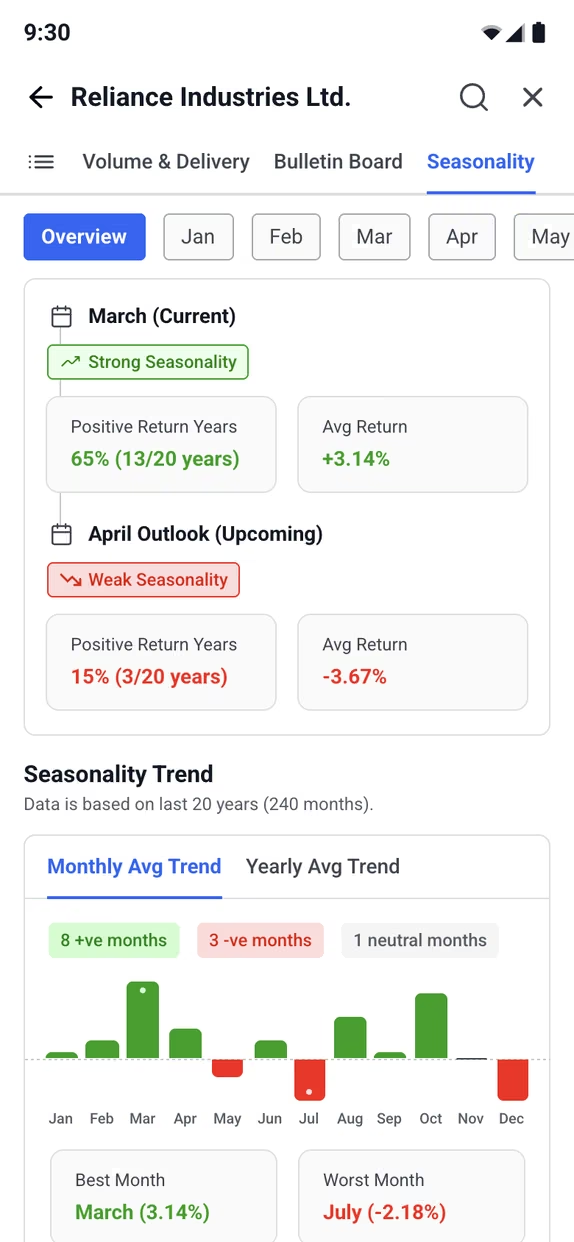
The Seasonality tab: this month's historical win rate and average return, above a month-by-month returns chart
SeasonalityTwenty years of returns, read as this month’s odds, with the month-by-month heatmap behind it
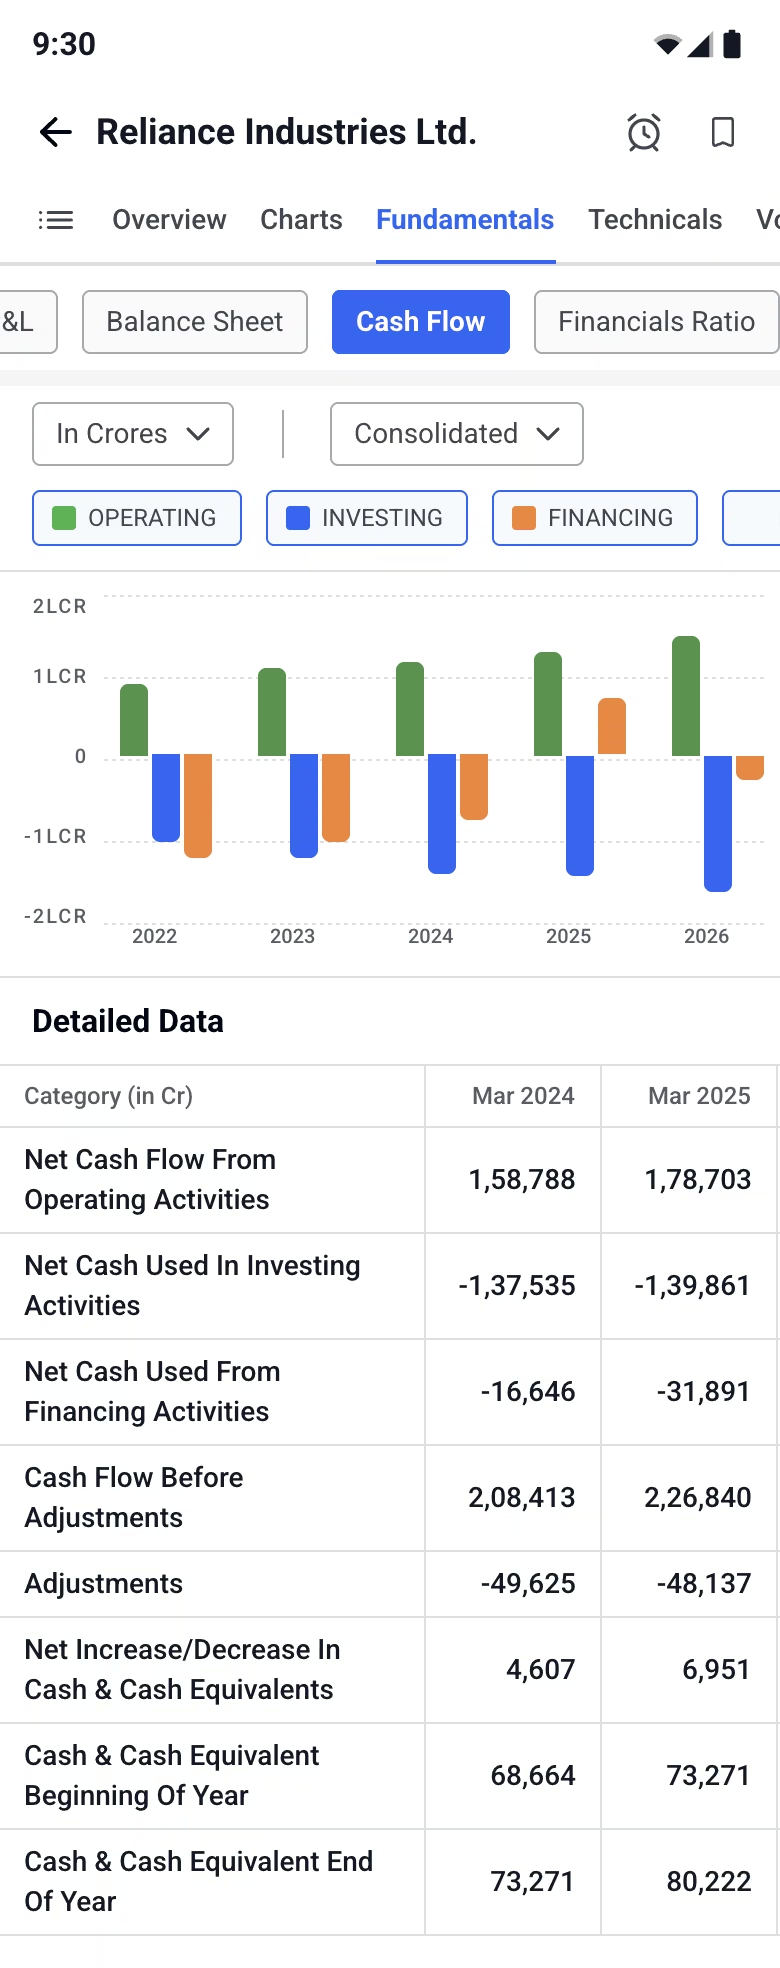
A cash-flow chart with operating, investing and financing bars per year, above a detailed table
Cash flowOperating, investing and financing, year on year

F&O and money flows

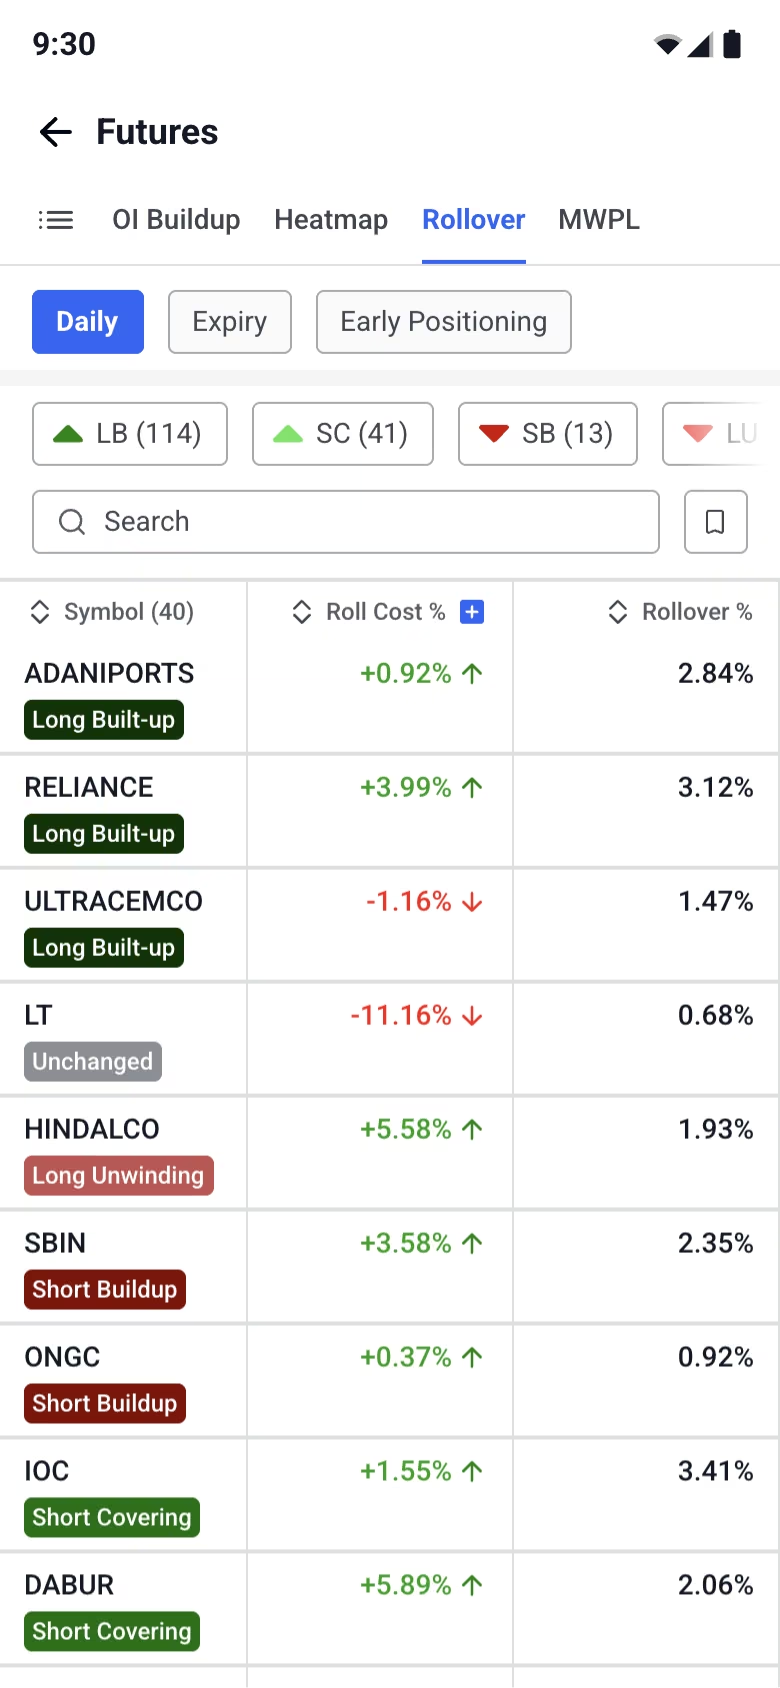
The futures rollover table with long build-up, short build-up and covering chips above it
Futures rolloverBuild-up chips filter the table in place
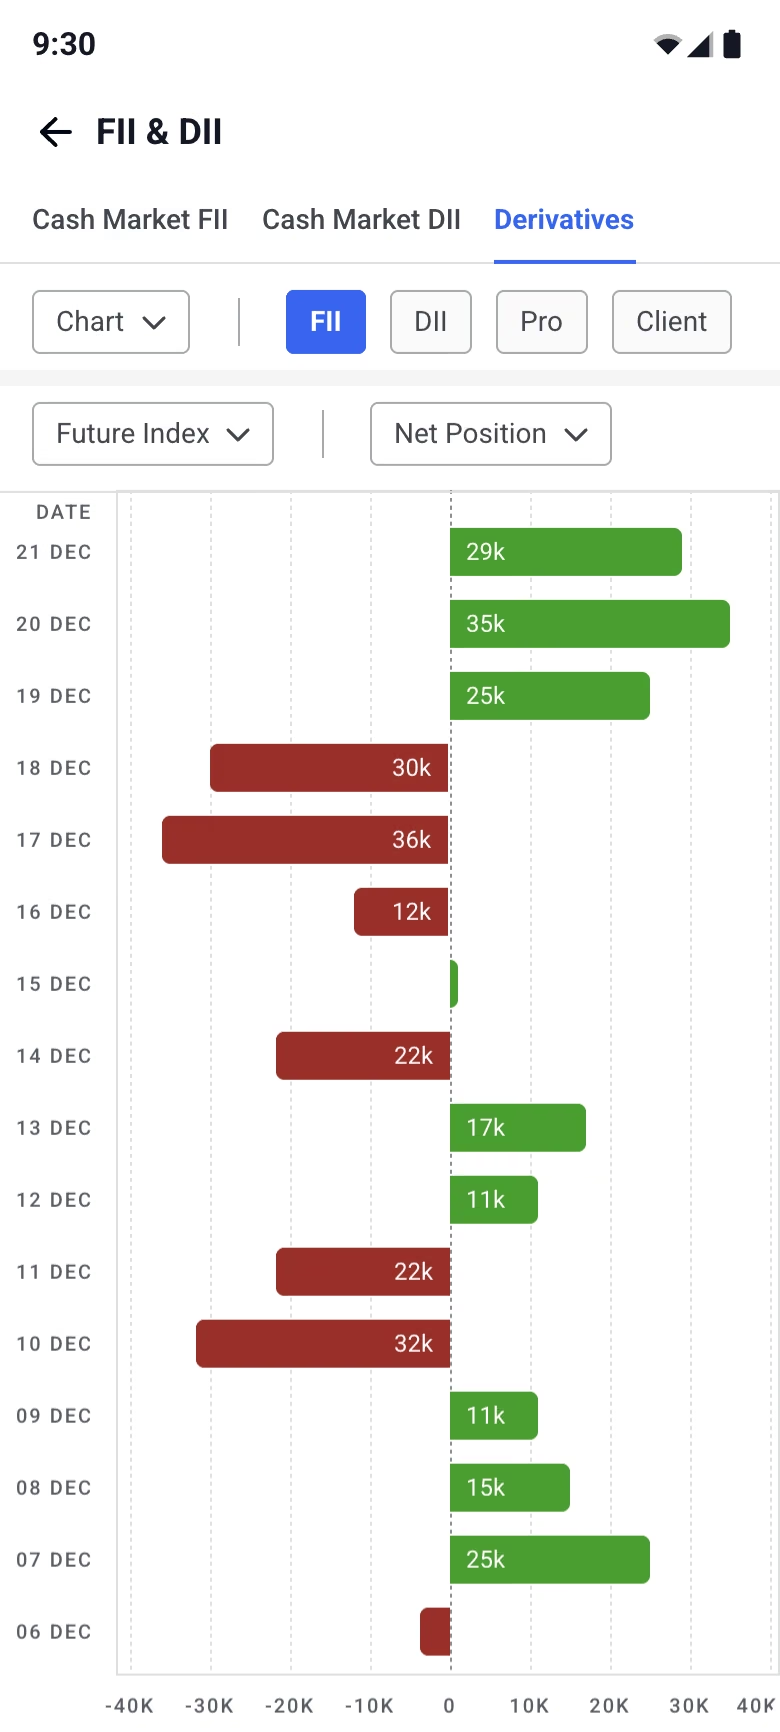
FII and DII derivative positions as diverging green and red bars, one per day
FII & DII flowsA diverging bar per day: long right, short left
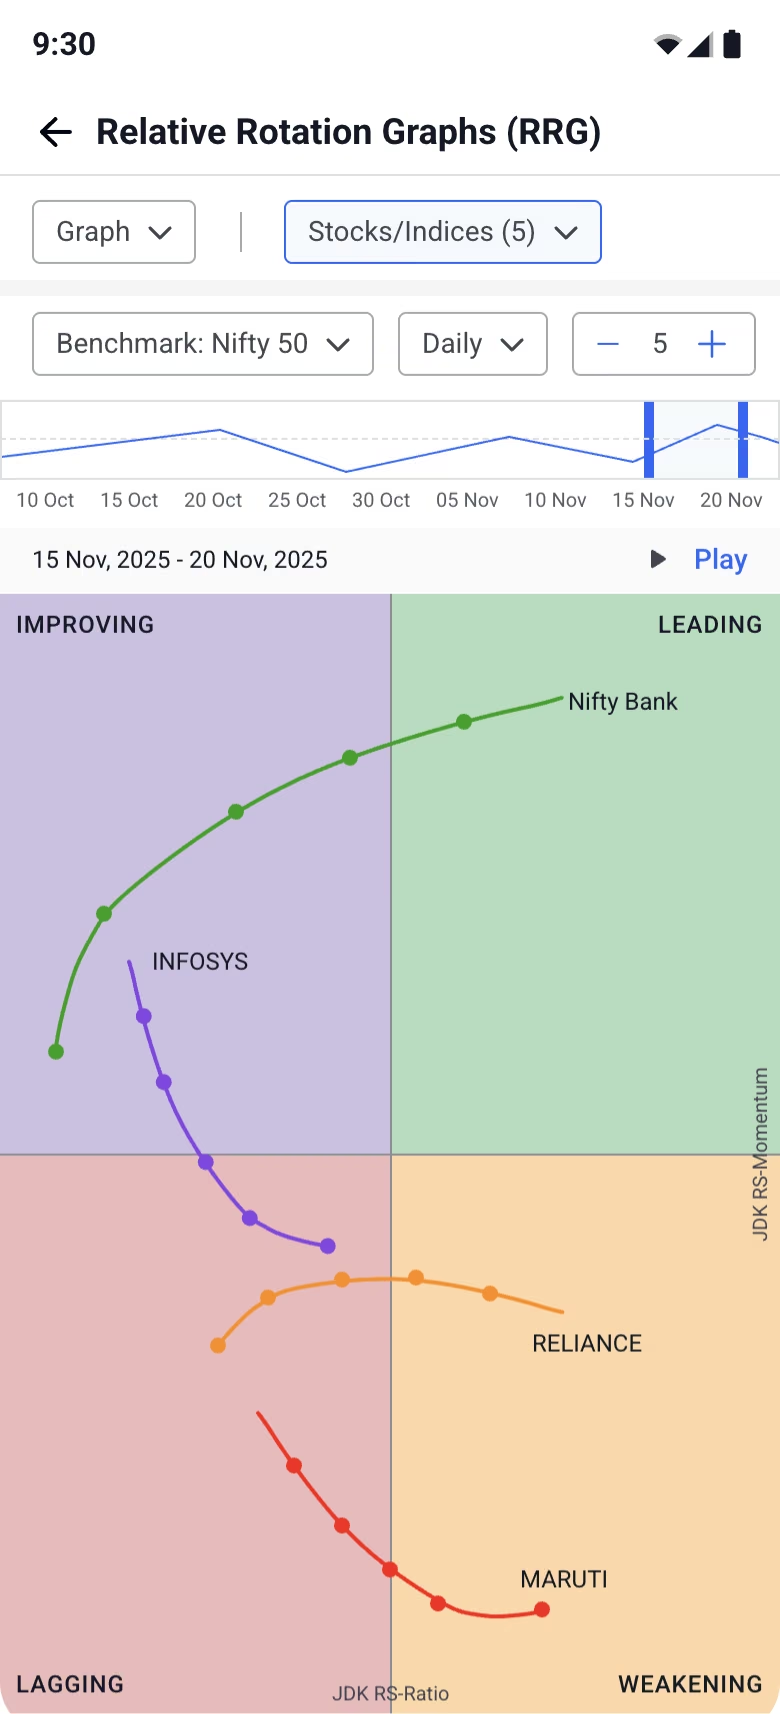
A relative rotation graph with improving, leading, weakening and lagging quadrants and a date replay bar
Relative rotationFour quadrants, a replay bar to watch sectors turn
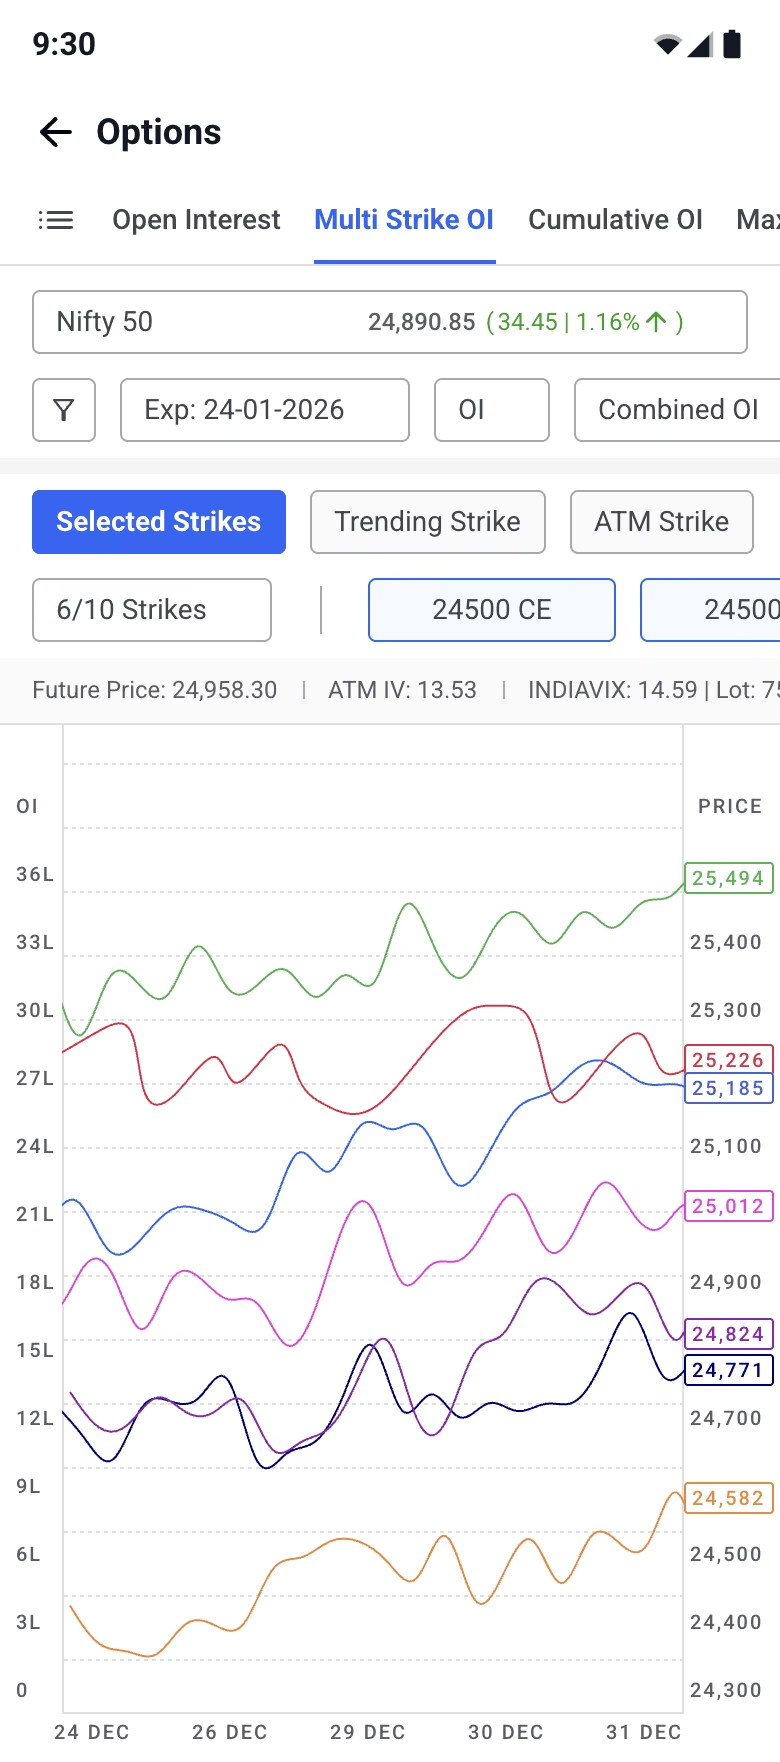
A multi-line chart of open interest for several strikes across the trading day
Multi-strike OIOpen interest across strikes, through the day
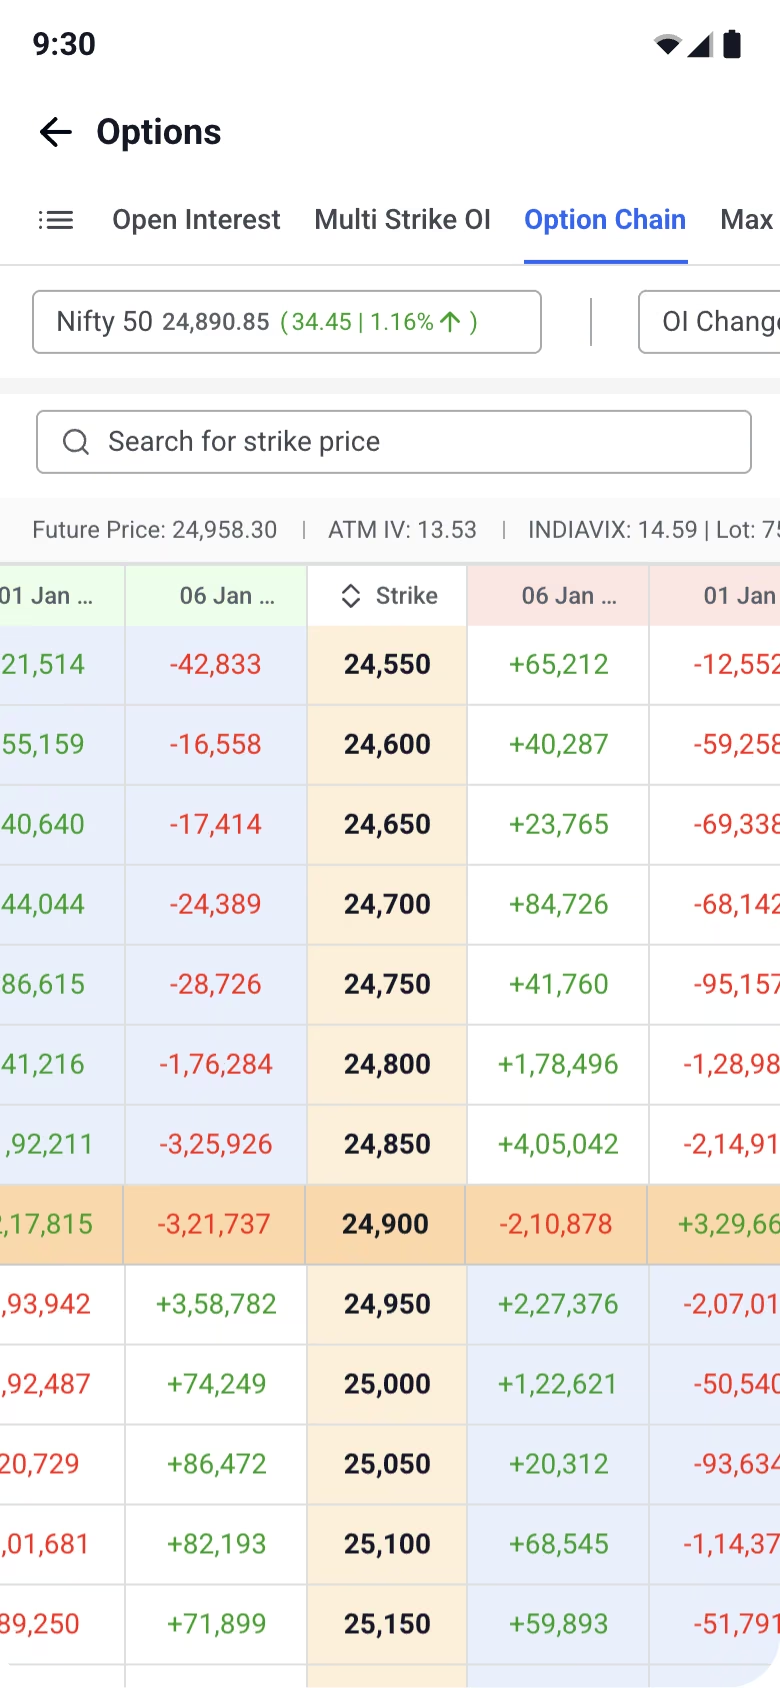
An option chain with calls on the left, strikes in the middle and puts on the right
Option chainCalls, strike and puts, ATM row anchored
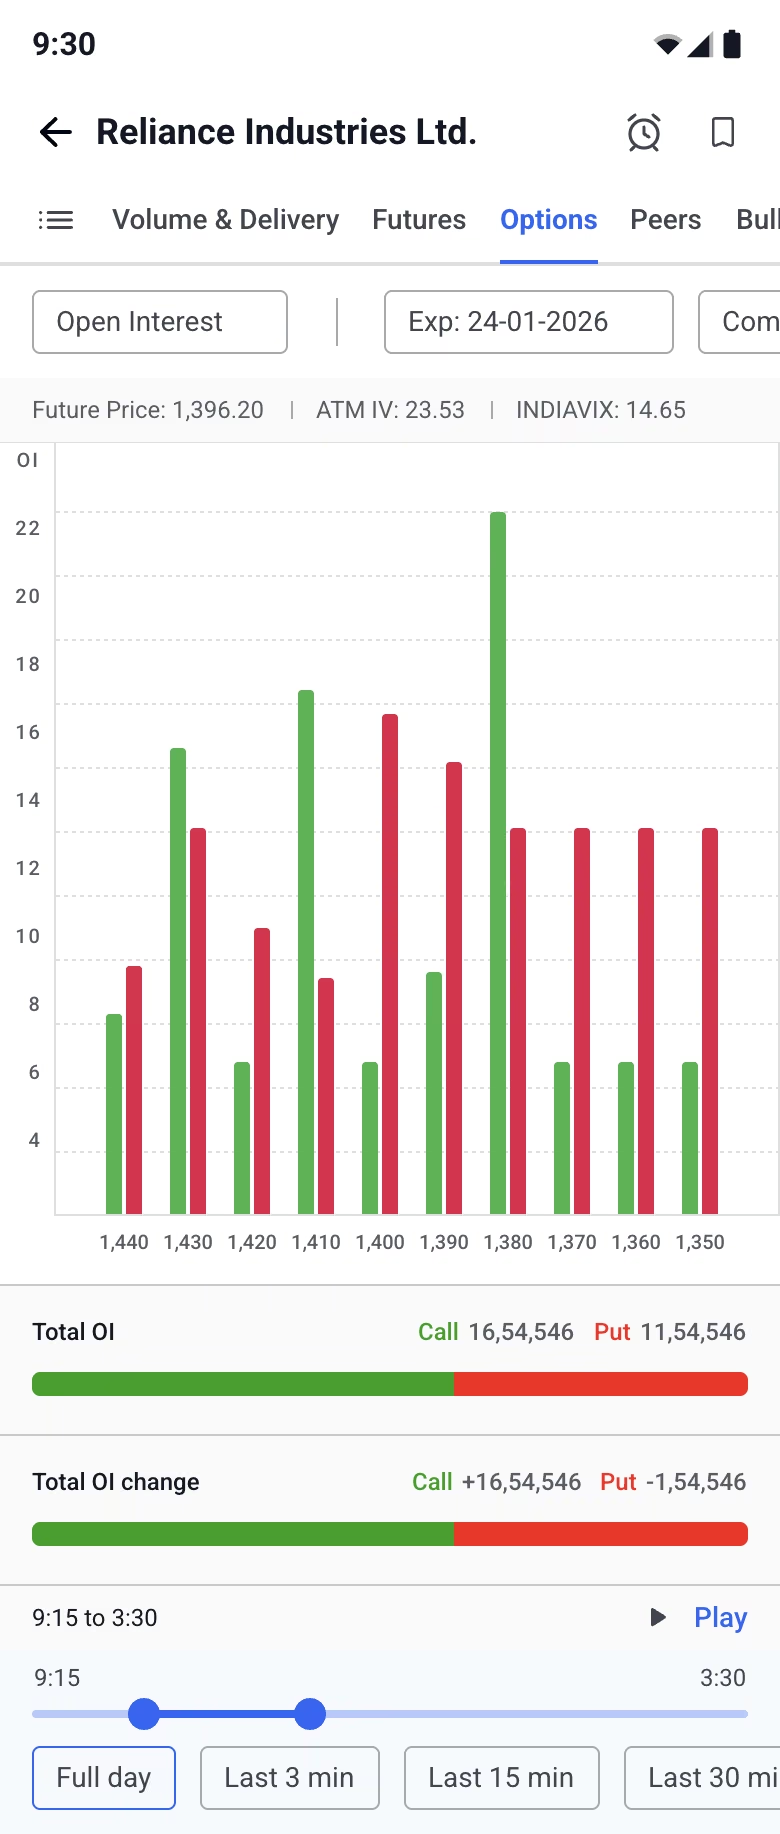
A bar chart of call and put open interest by strike, with a replay control
Options open interestCall and put OI by strike, with an intraday replay

Research and scanners

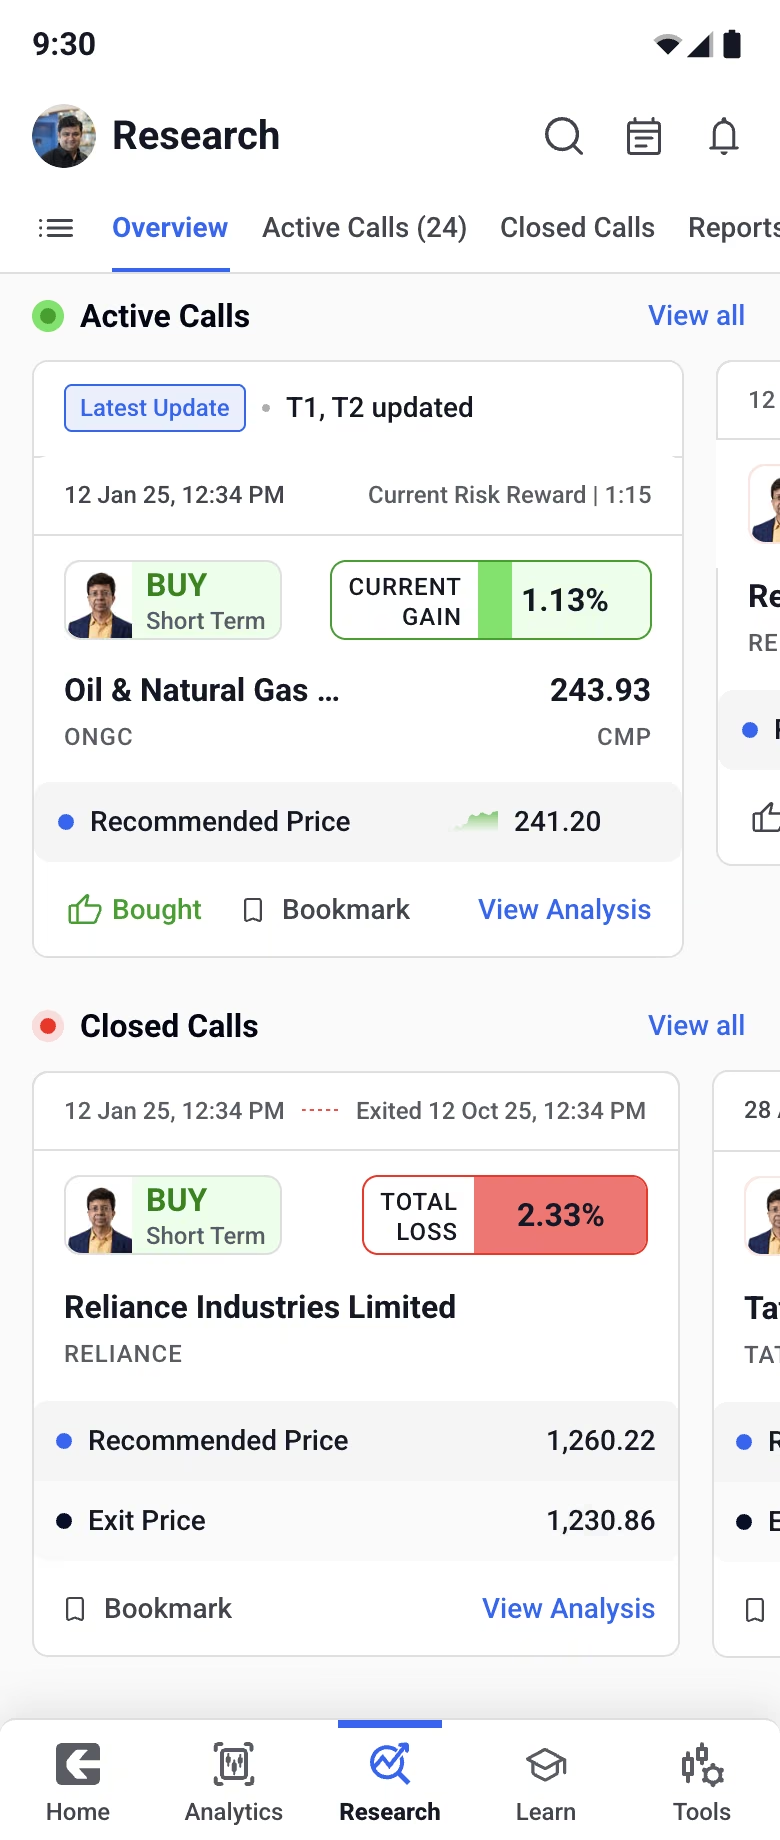
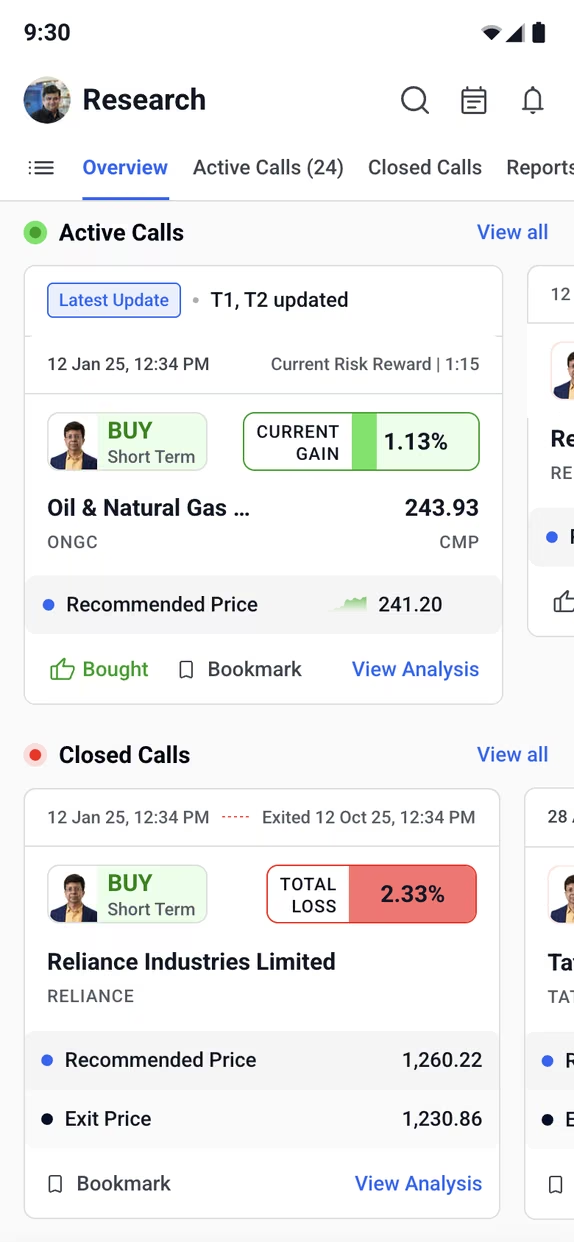
The Research tab listing active buy calls with entry, target and current gain
ResearchActive and closed calls, one swipe each
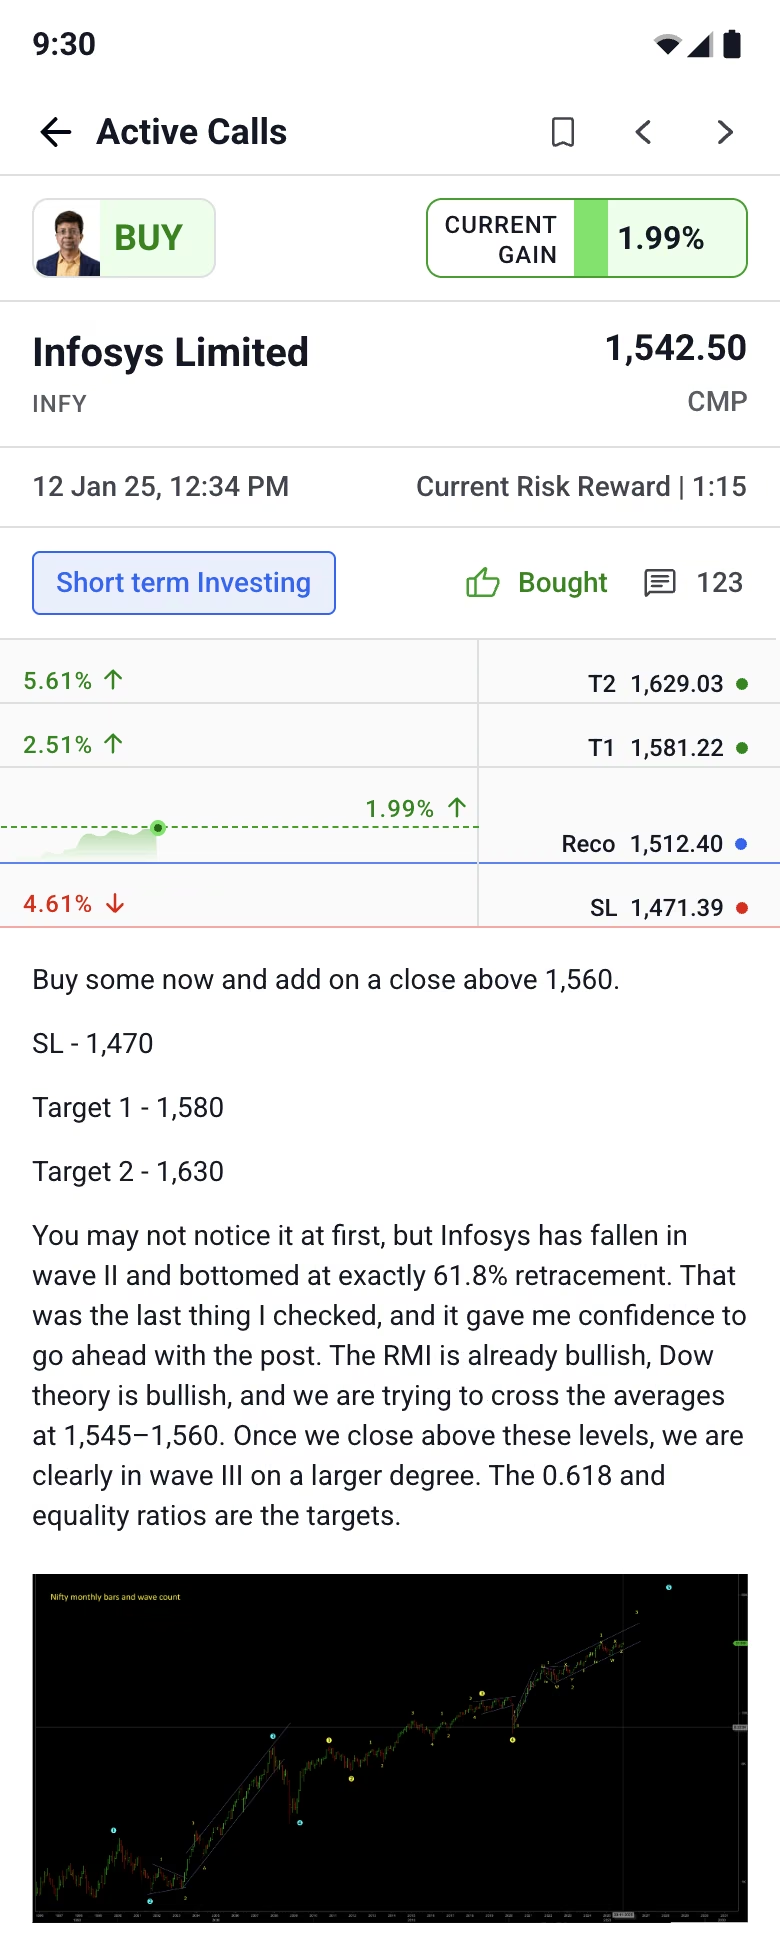
A research call for Infosys with entry, both targets and the stop-loss on one price ladder
Call detailEntry, targets and stop-loss on one ladder
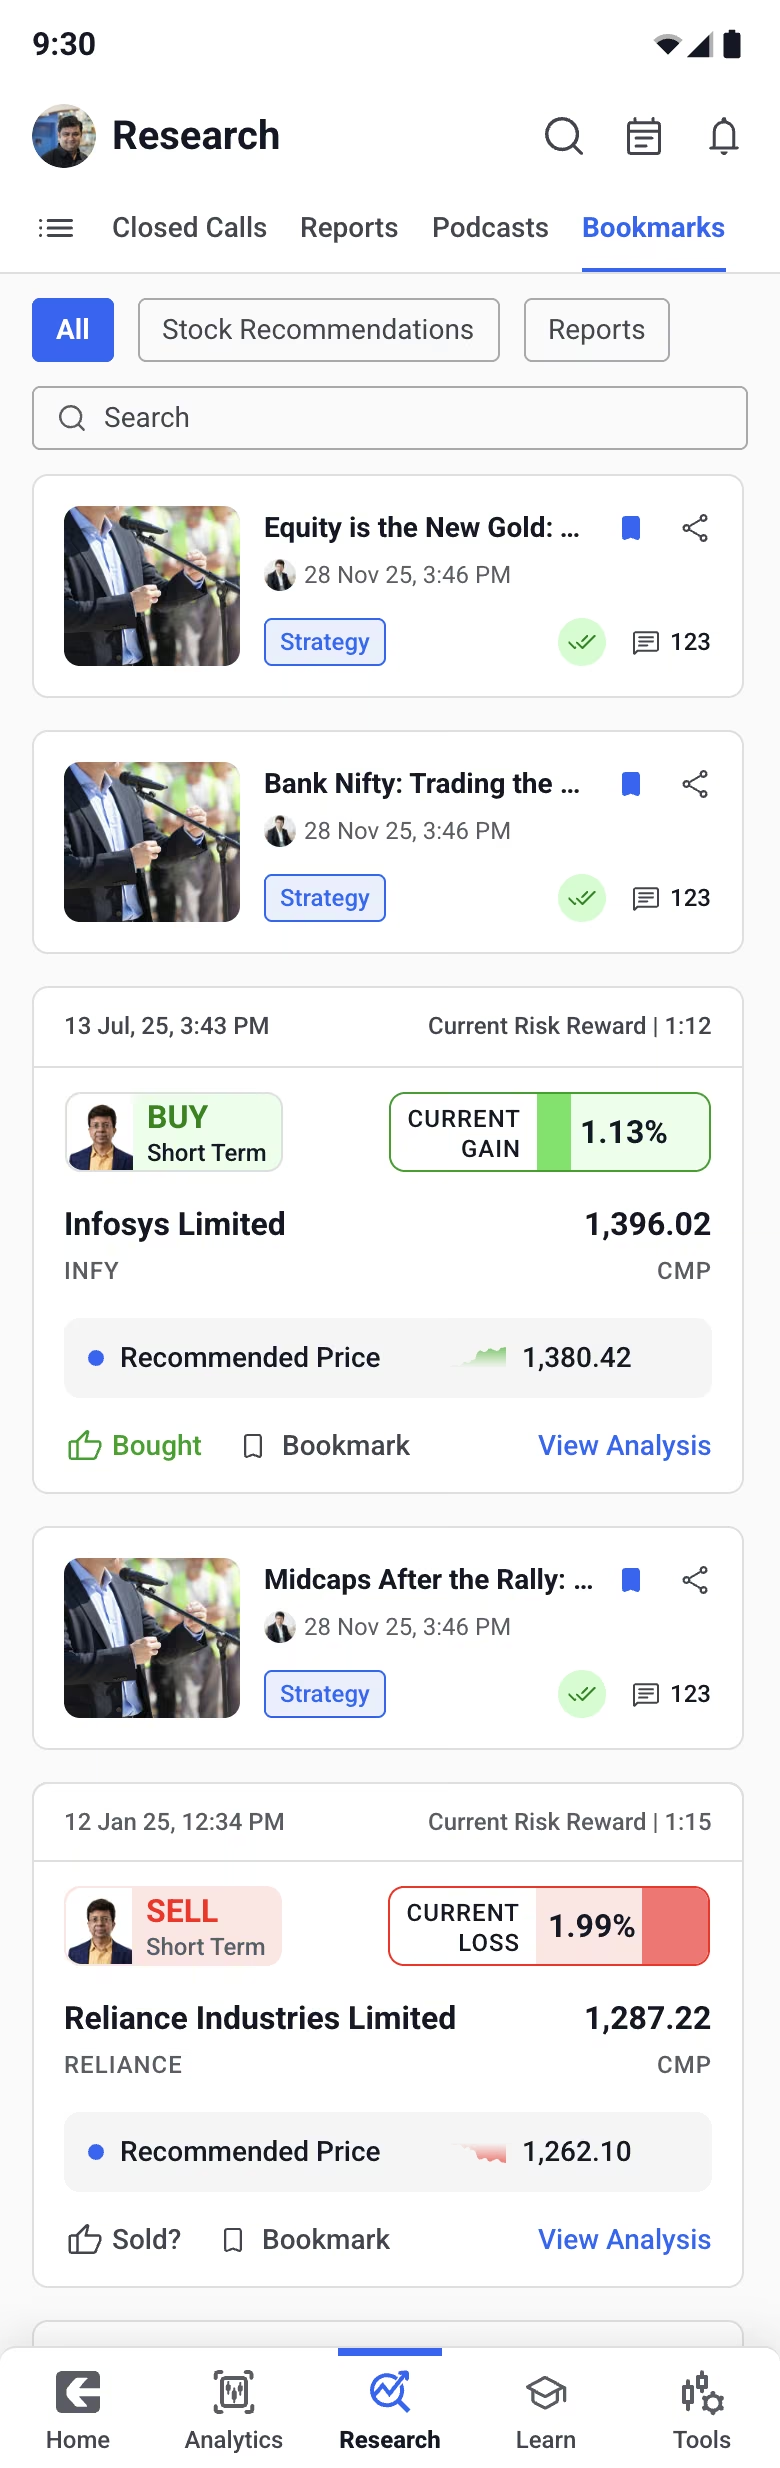
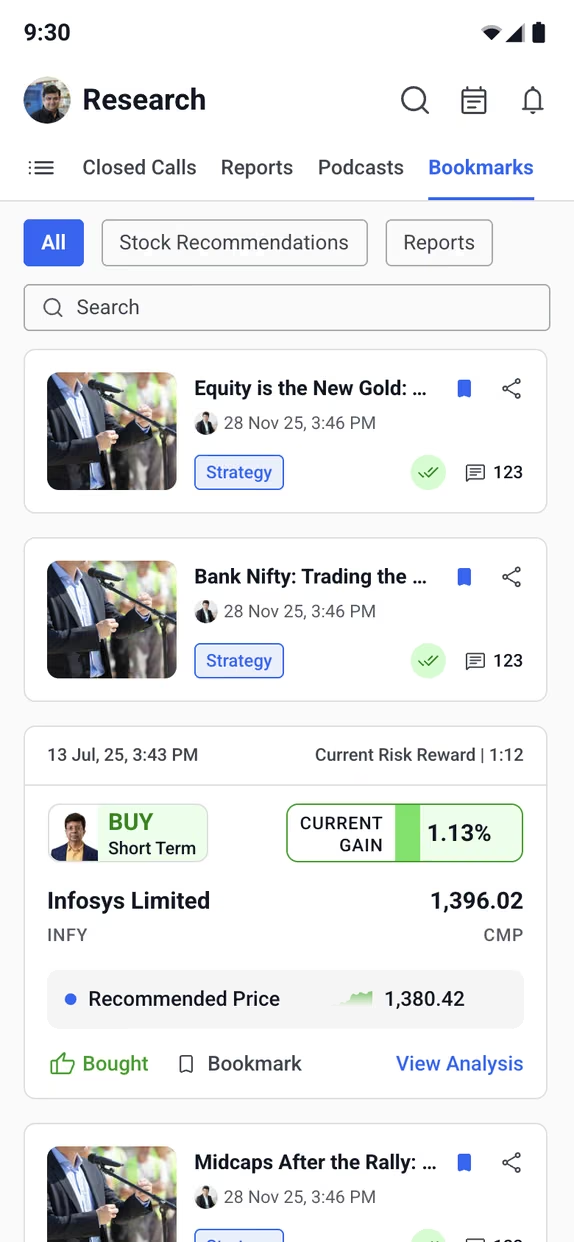
Bookmarked research: saved calls and reports in one list
BookmarksBuy and sell calls side by side with reports
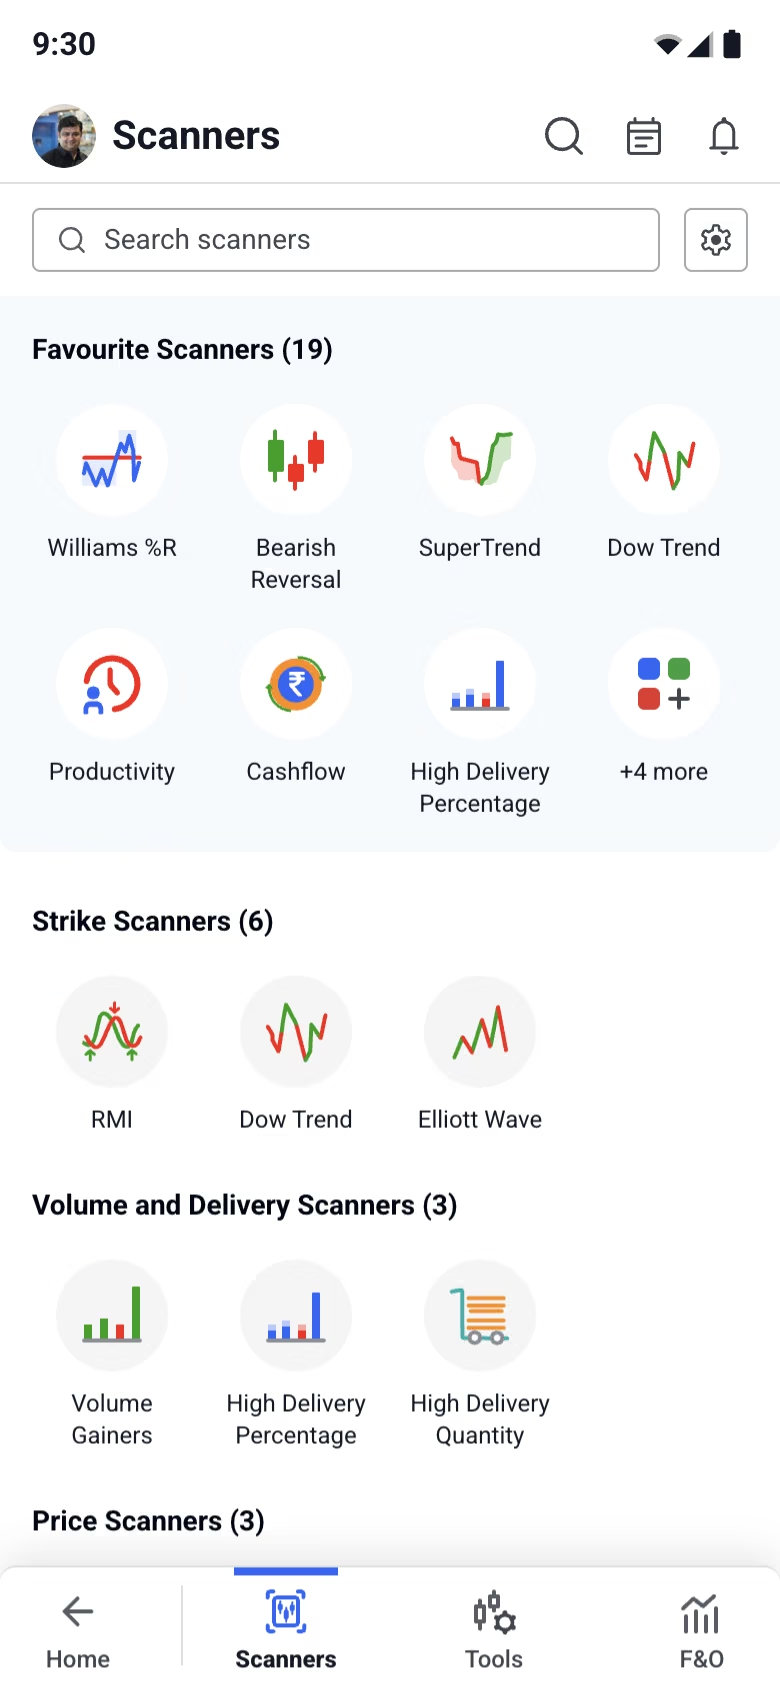
The Scanners home: favourite scanners as icons, then scanner groups
ScannersFavourites first, then every scanner by group
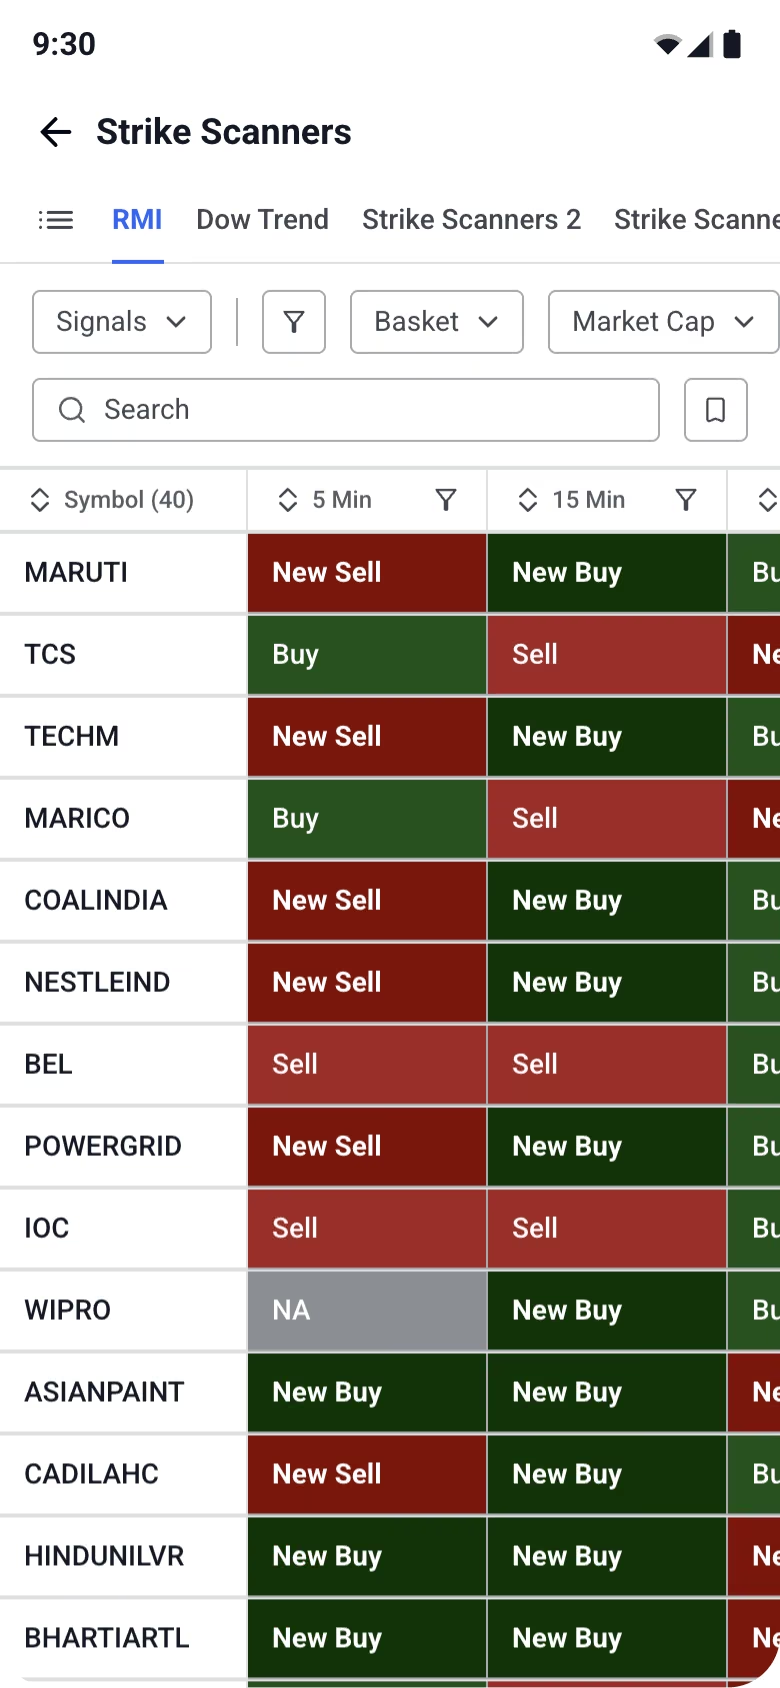
A grid of stocks against timeframes, each cell a buy or sell signal
Scanner signalsEvery timeframe for every stock, at a glance
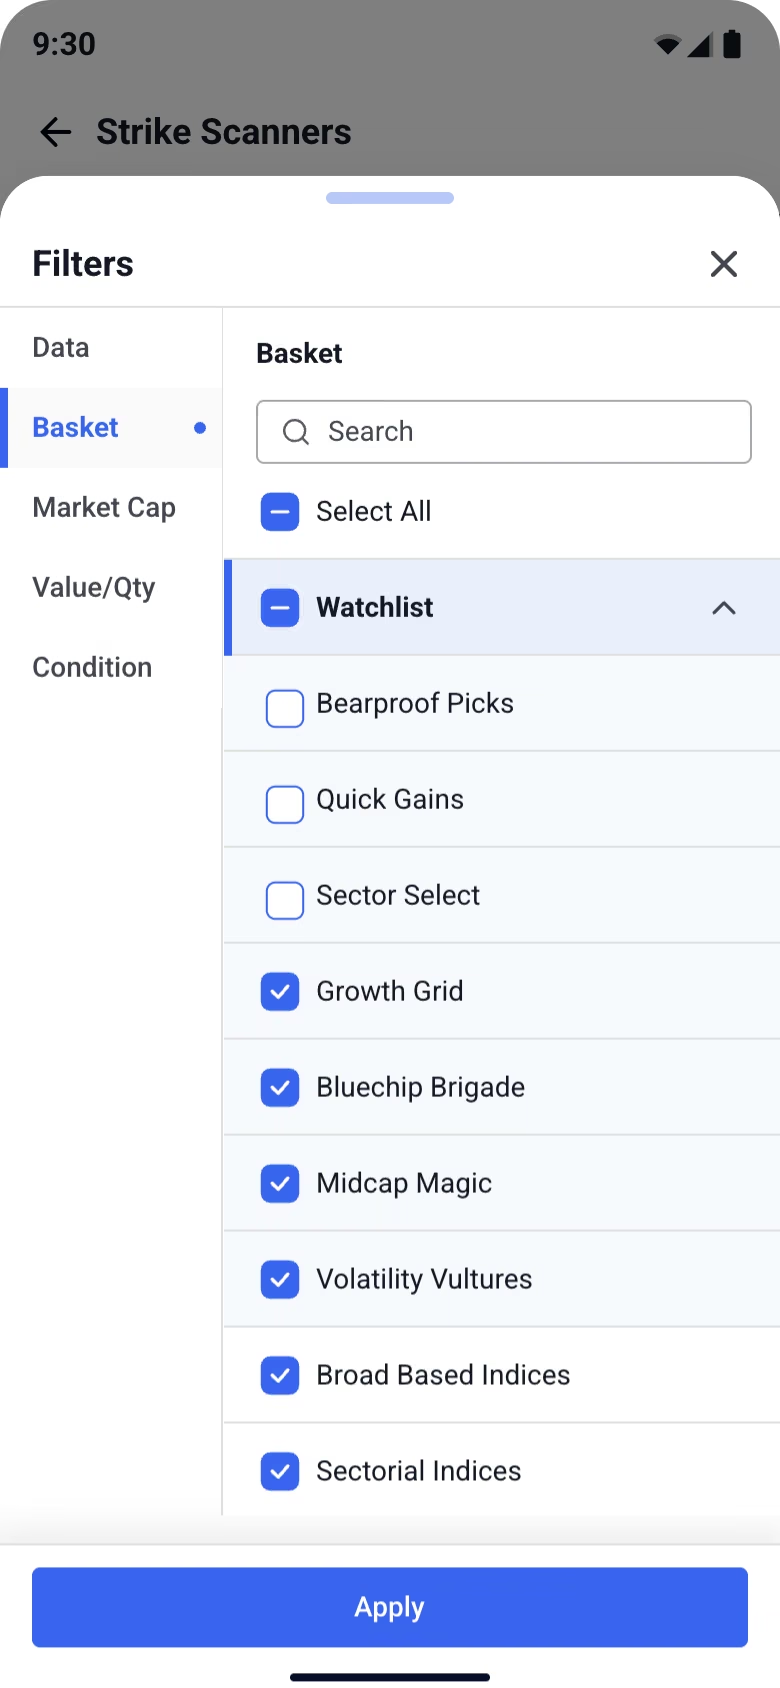
A filter bottom sheet with basket options such as Nifty 50 and sector indices
Filter sheetNarrow the basket without leaving the grid

Learning

A course catalogue of trading courses, each card with its mentor, level, price and discount
Course catalogueLevel, price and the real discount on one card
A course page for Basics of Dow Theory: mentor, about the course, ratings and learner count
Course detailWhat you’ll learn before what it costs
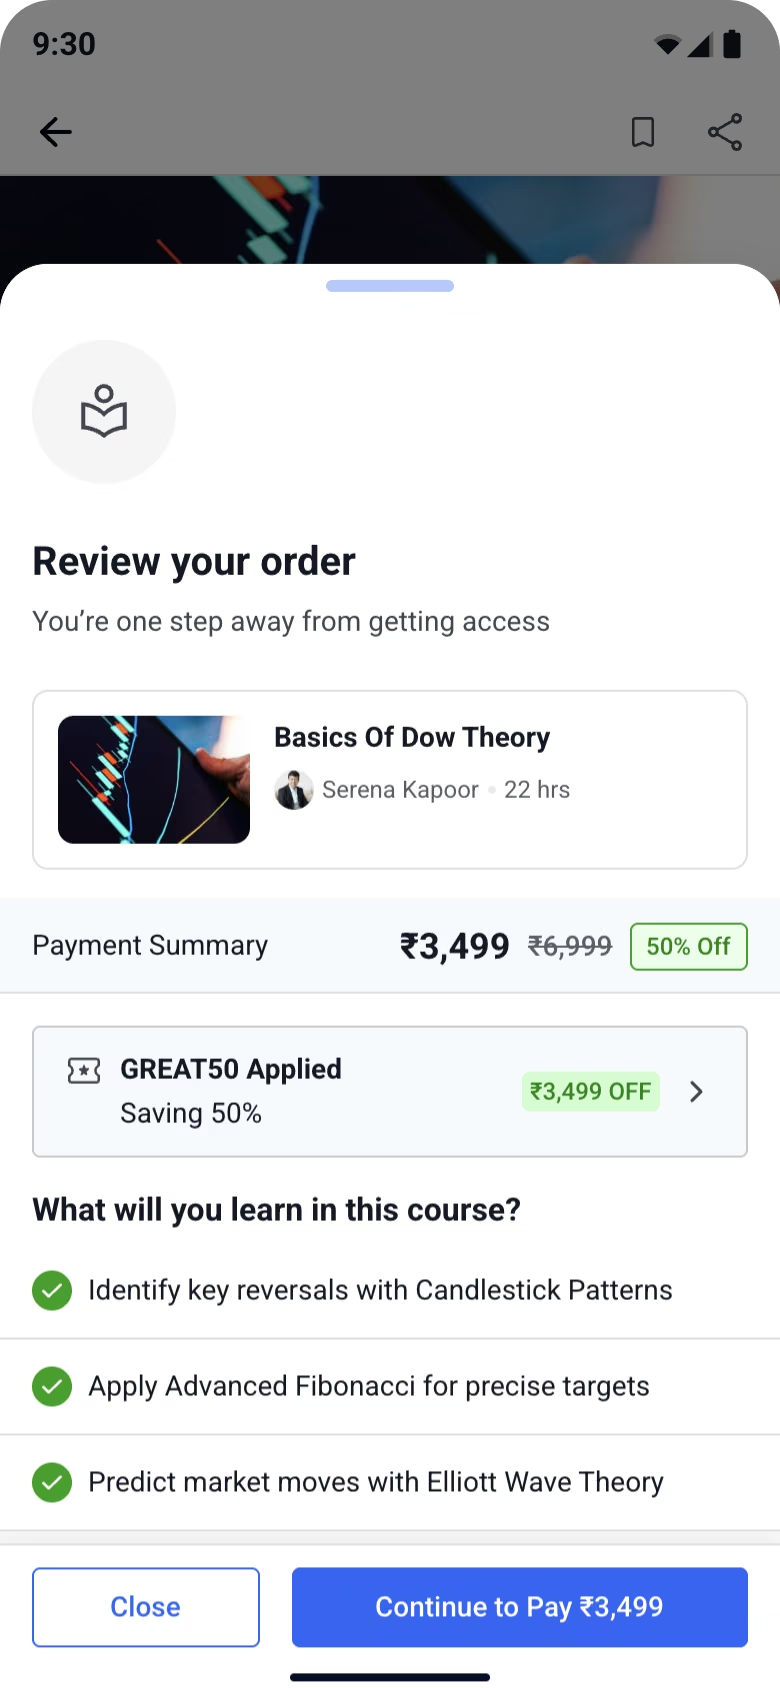
A checkout bottom sheet with an applied coupon, the total and what the course covers
Checkout sheetCoupon and total, without leaving the course
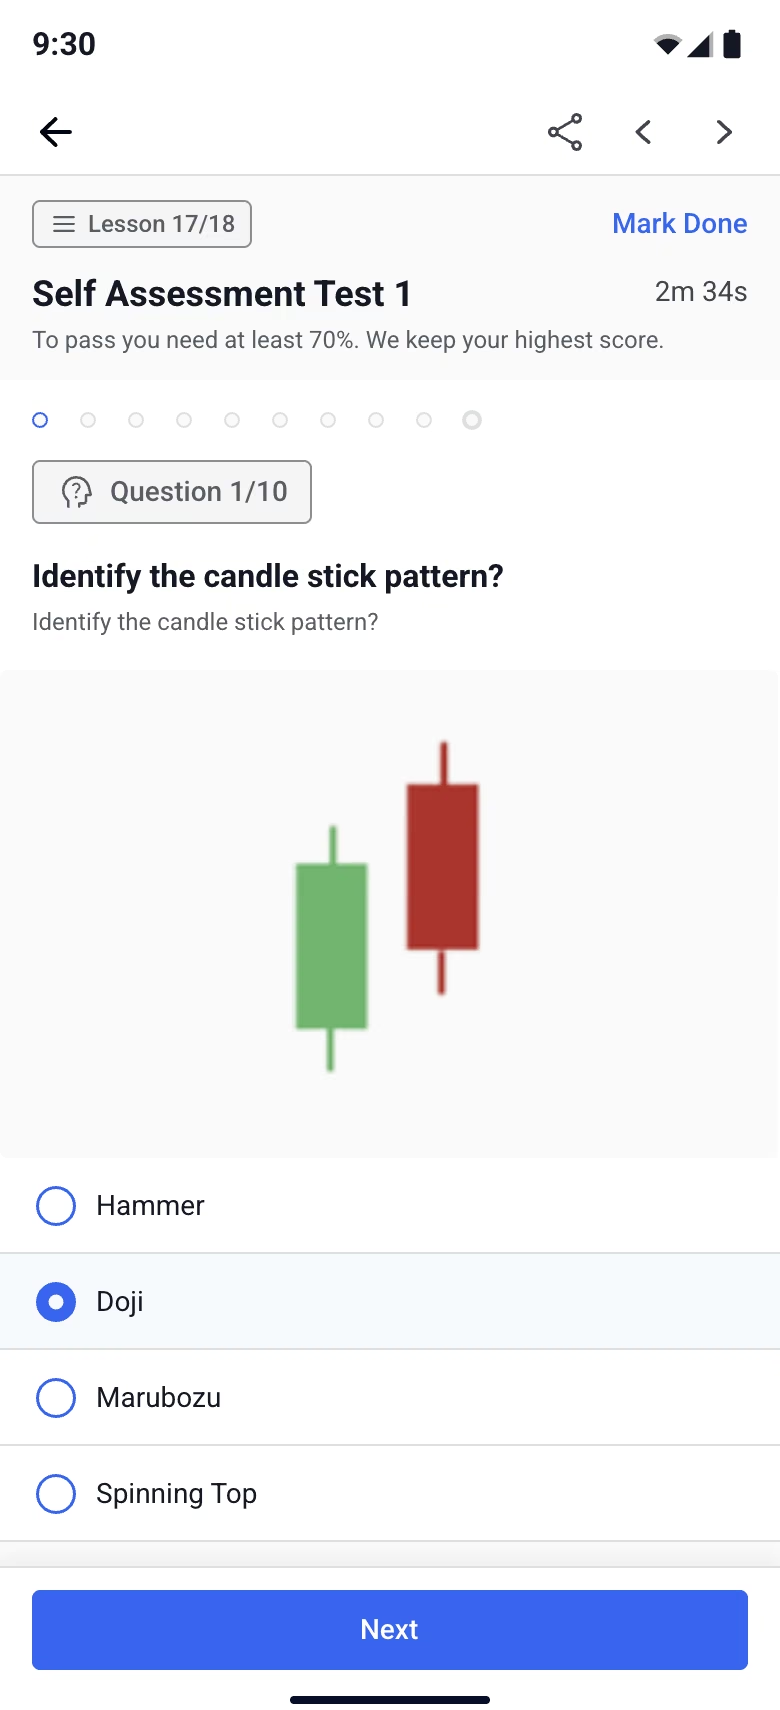
A quiz question about a candlestick pattern, with answer options and a timer
Lesson quizOne question, a timer, progress dots
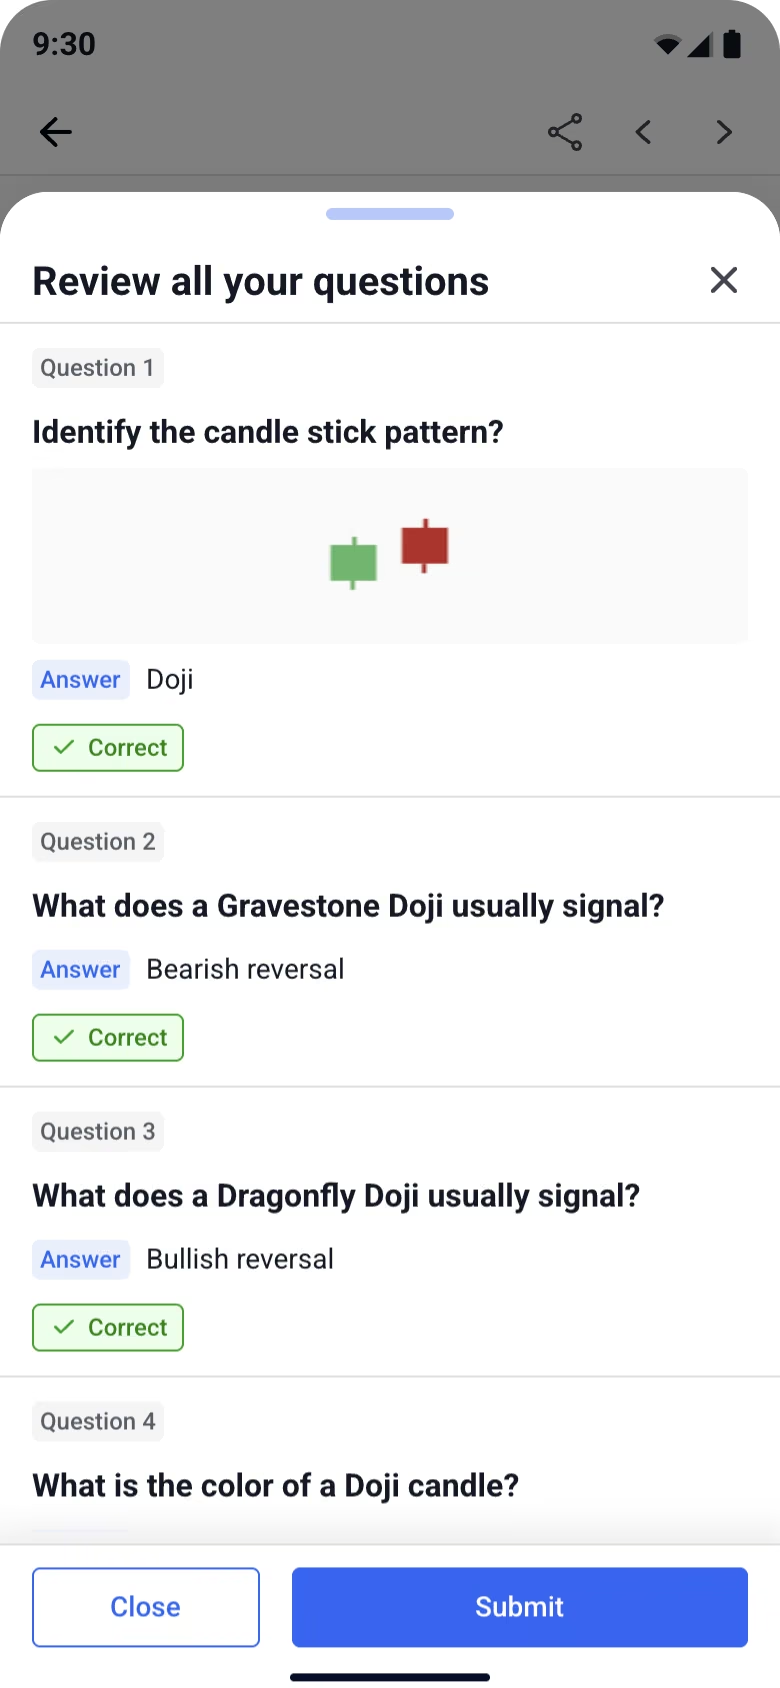
A bottom sheet listing each quiz question with the chosen answer, before submitting
Answer reviewEvery answer checked before submitting
A completed course with a star rating prompt and a rewatch button
Course completedRate it inline, rewatch from the top
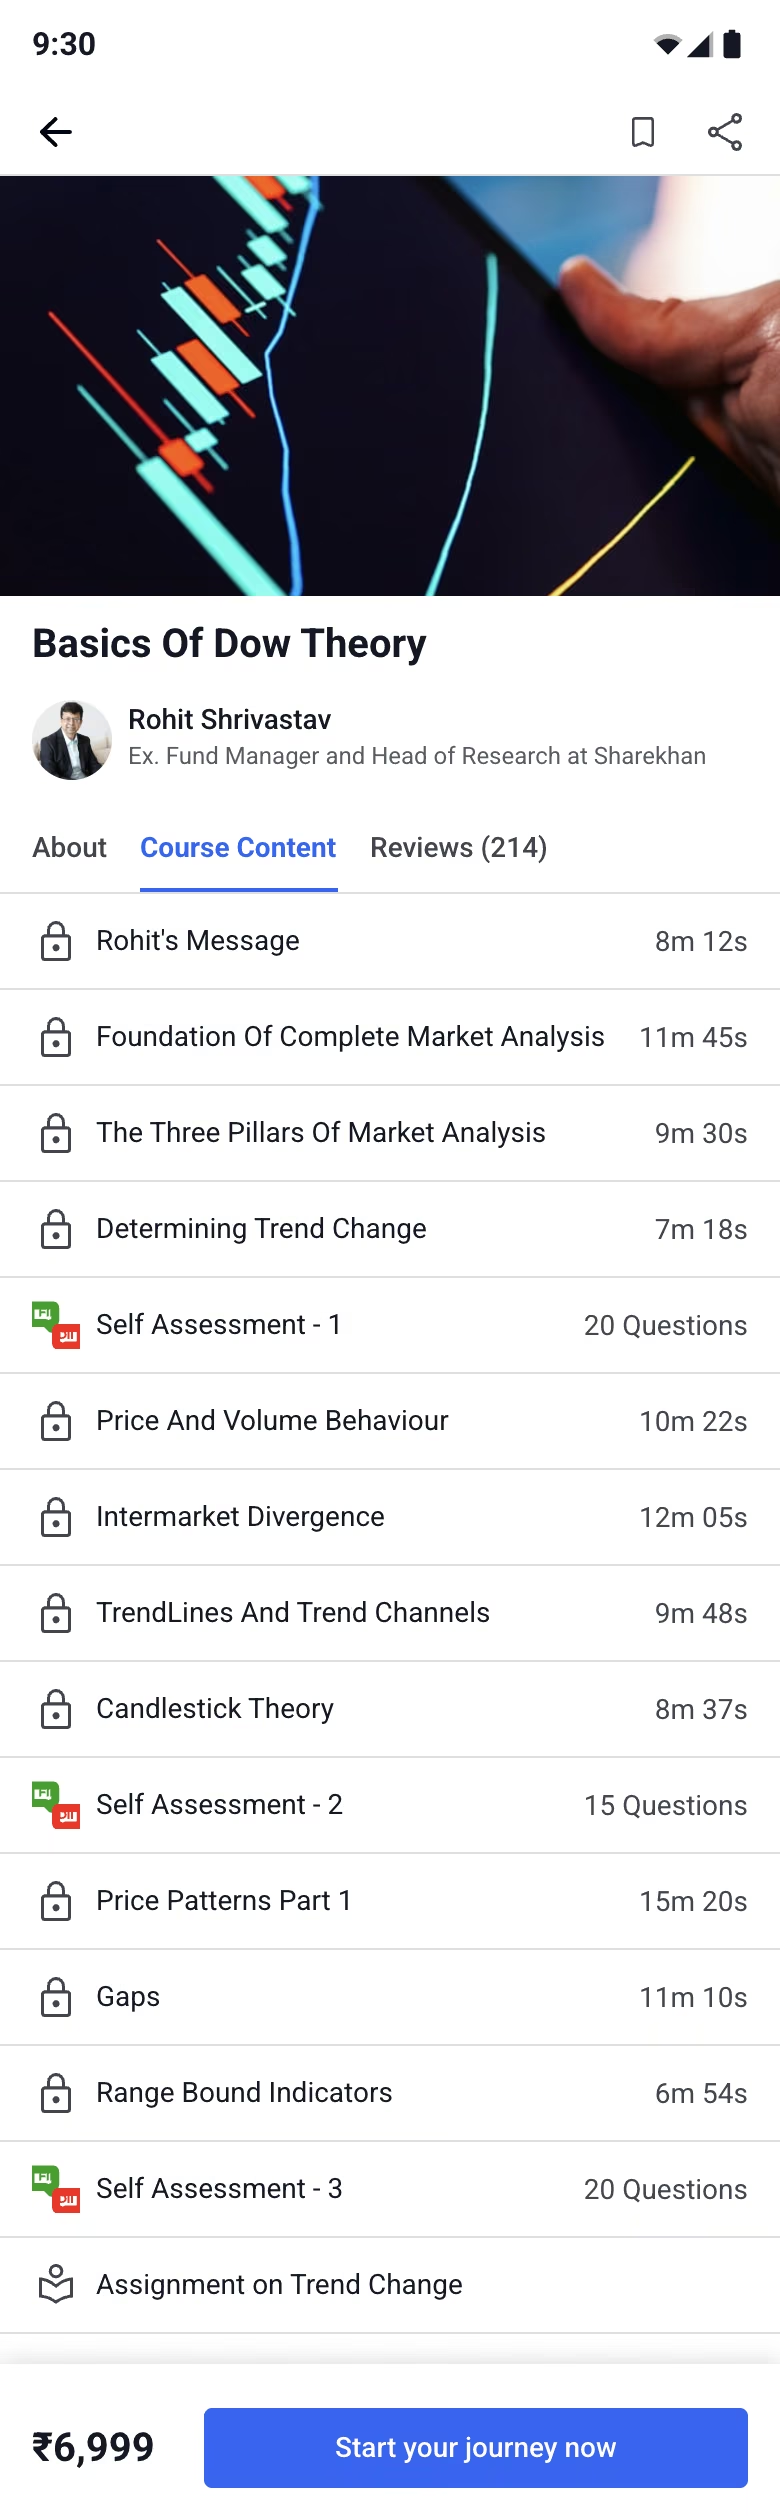
The course content list: lessons with durations, quizzes and an assignment
Course contentLessons, quizzes and an assignment in one list
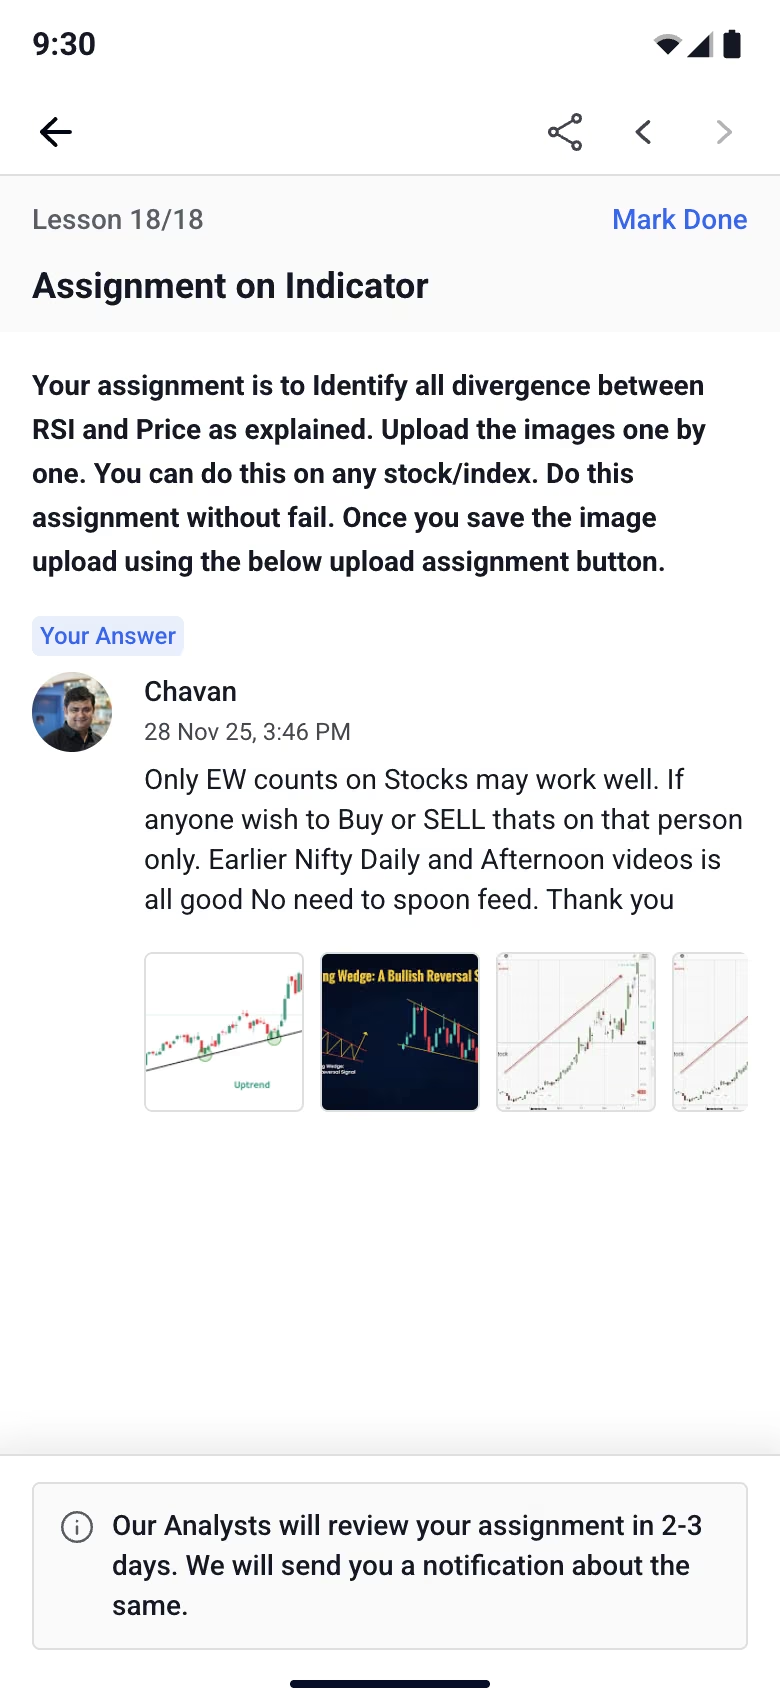
A submitted assignment with the learner's answer and a note that an analyst will review it
Assignment submittedAn analyst reviews it within 2–3 days
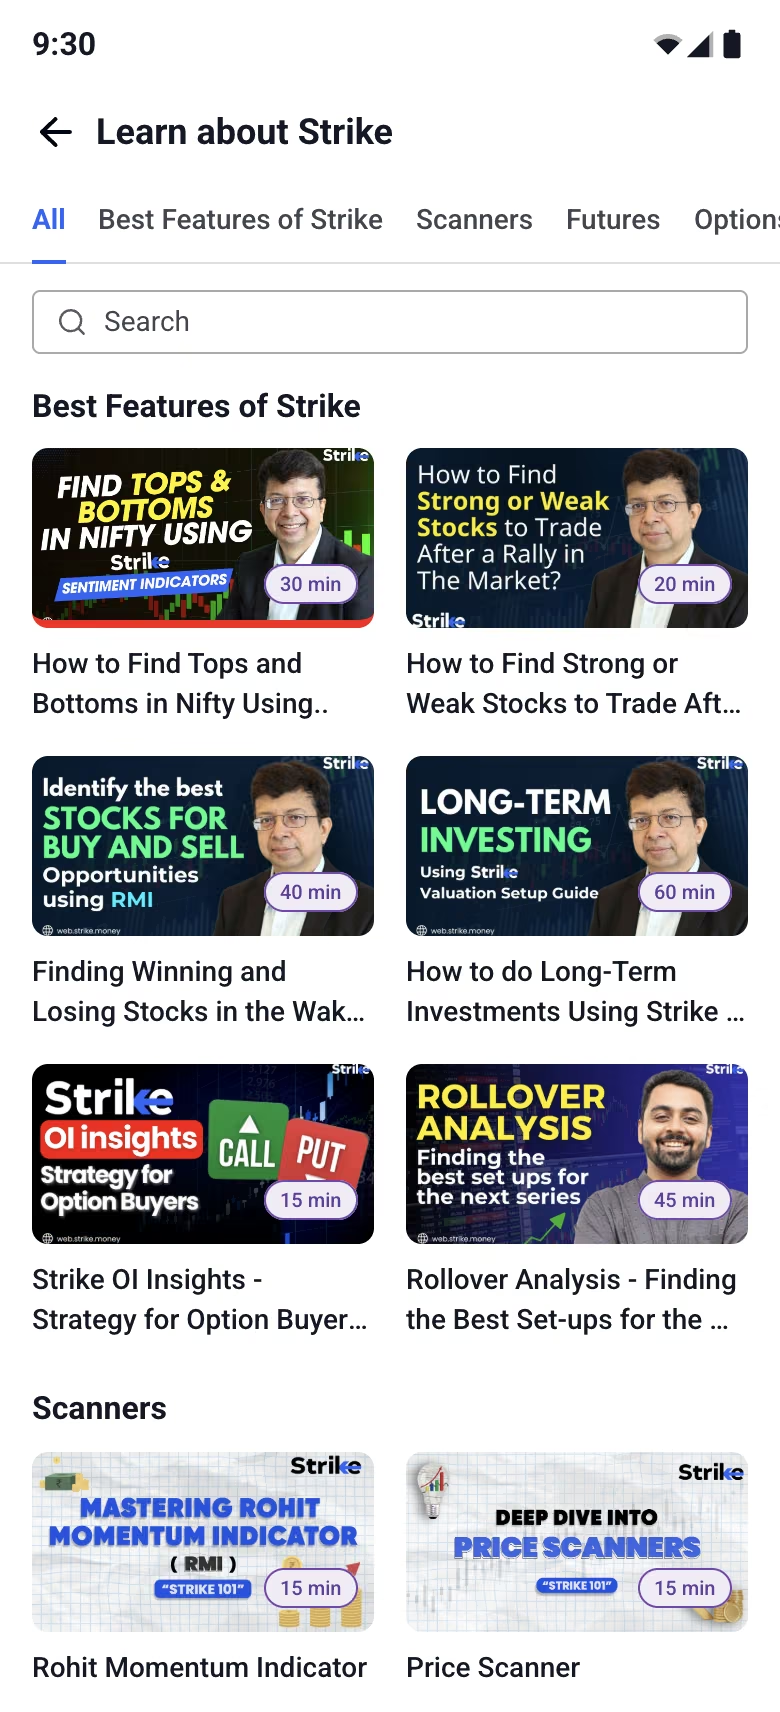
A library of short feature videos about Strike, grouped by topic
Learn about StrikeShort videos on every feature, by topic

Plans and account

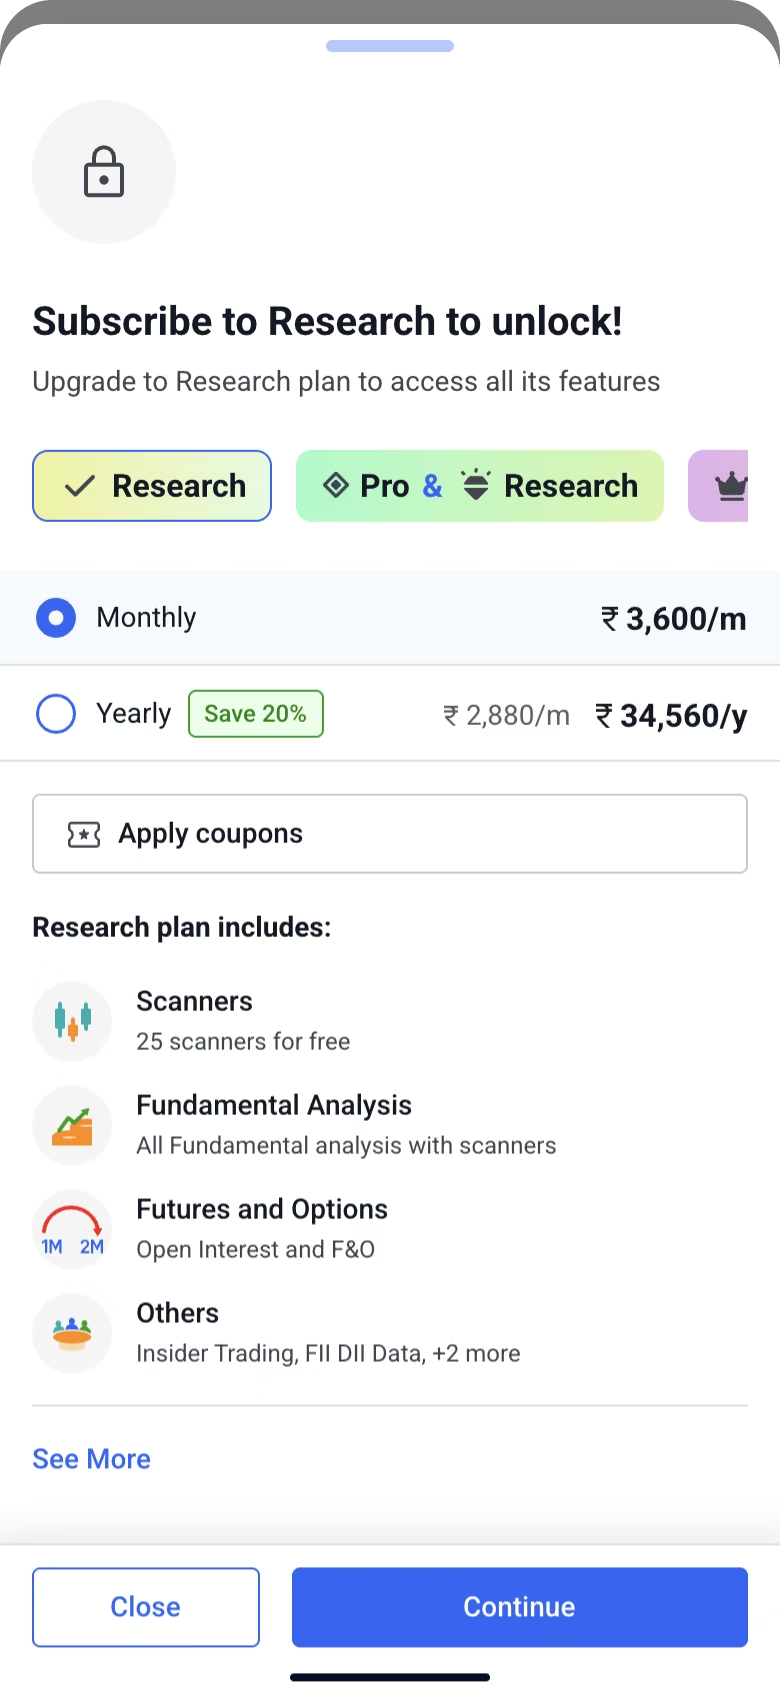
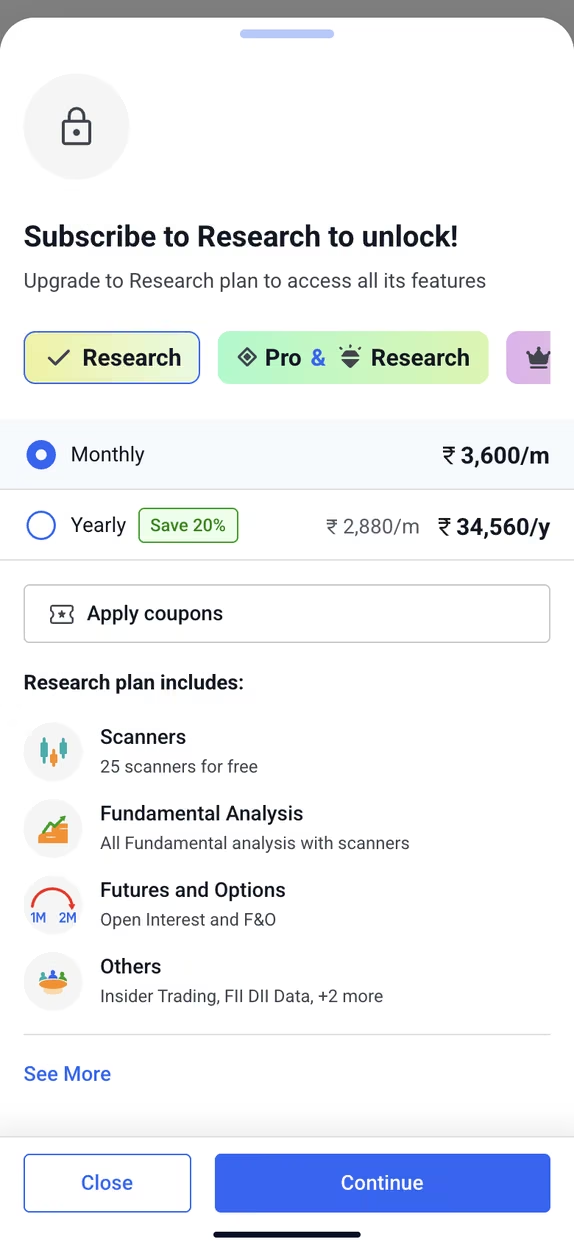
A bottom sheet to subscribe to Research, with monthly and yearly prices and what the plan includes
Paywall sheetThe plan, the price and what it unlocks
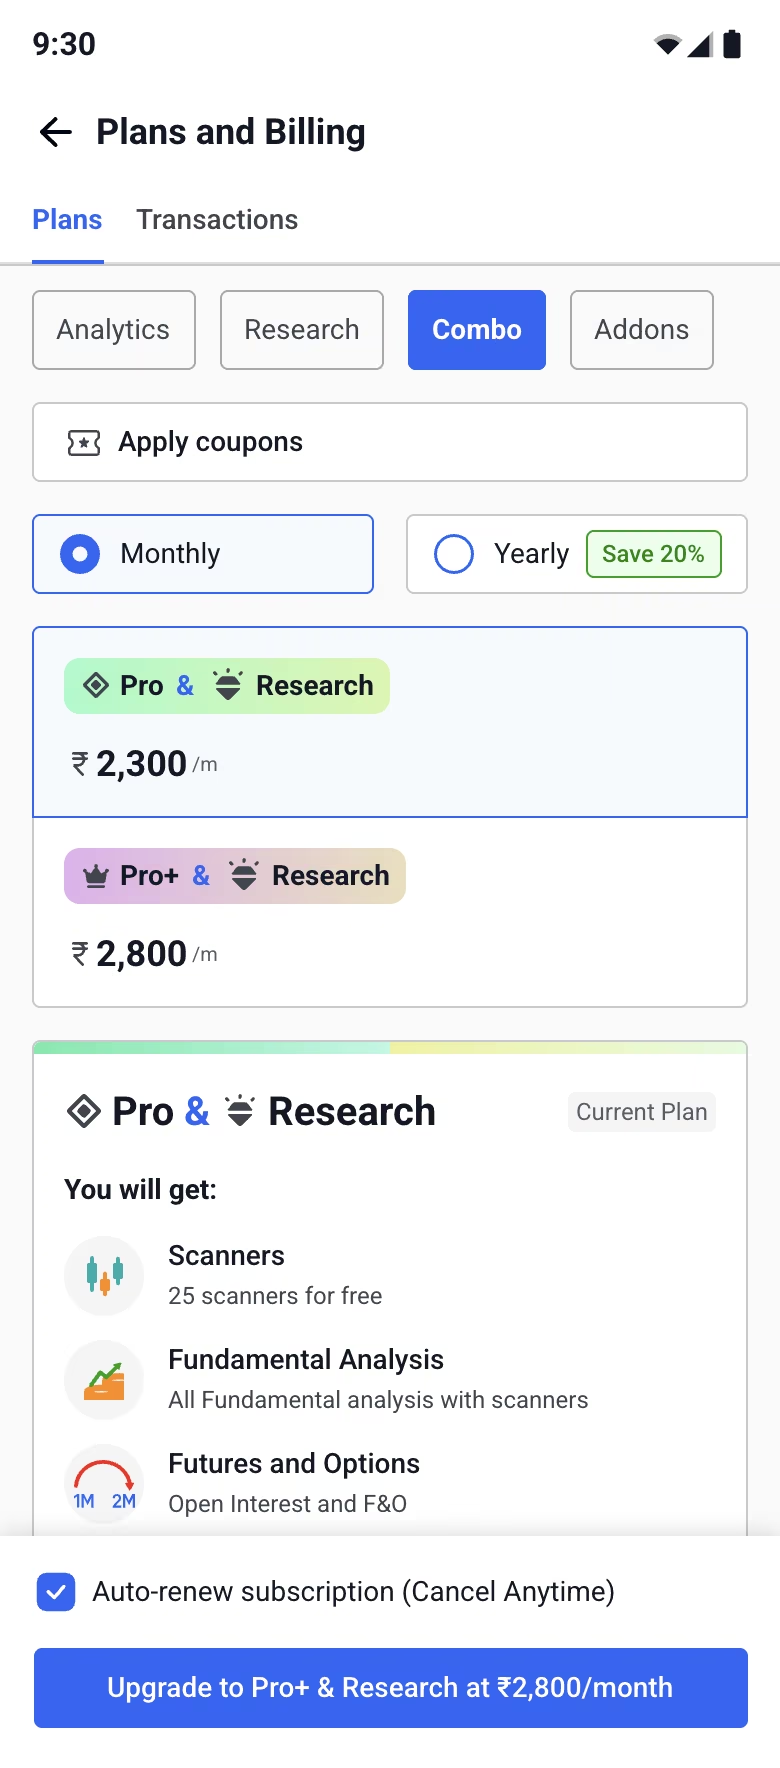
Plans and billing: Analytics, Research and combo plans with prices
Plans and billingCombos compared, with the current plan marked
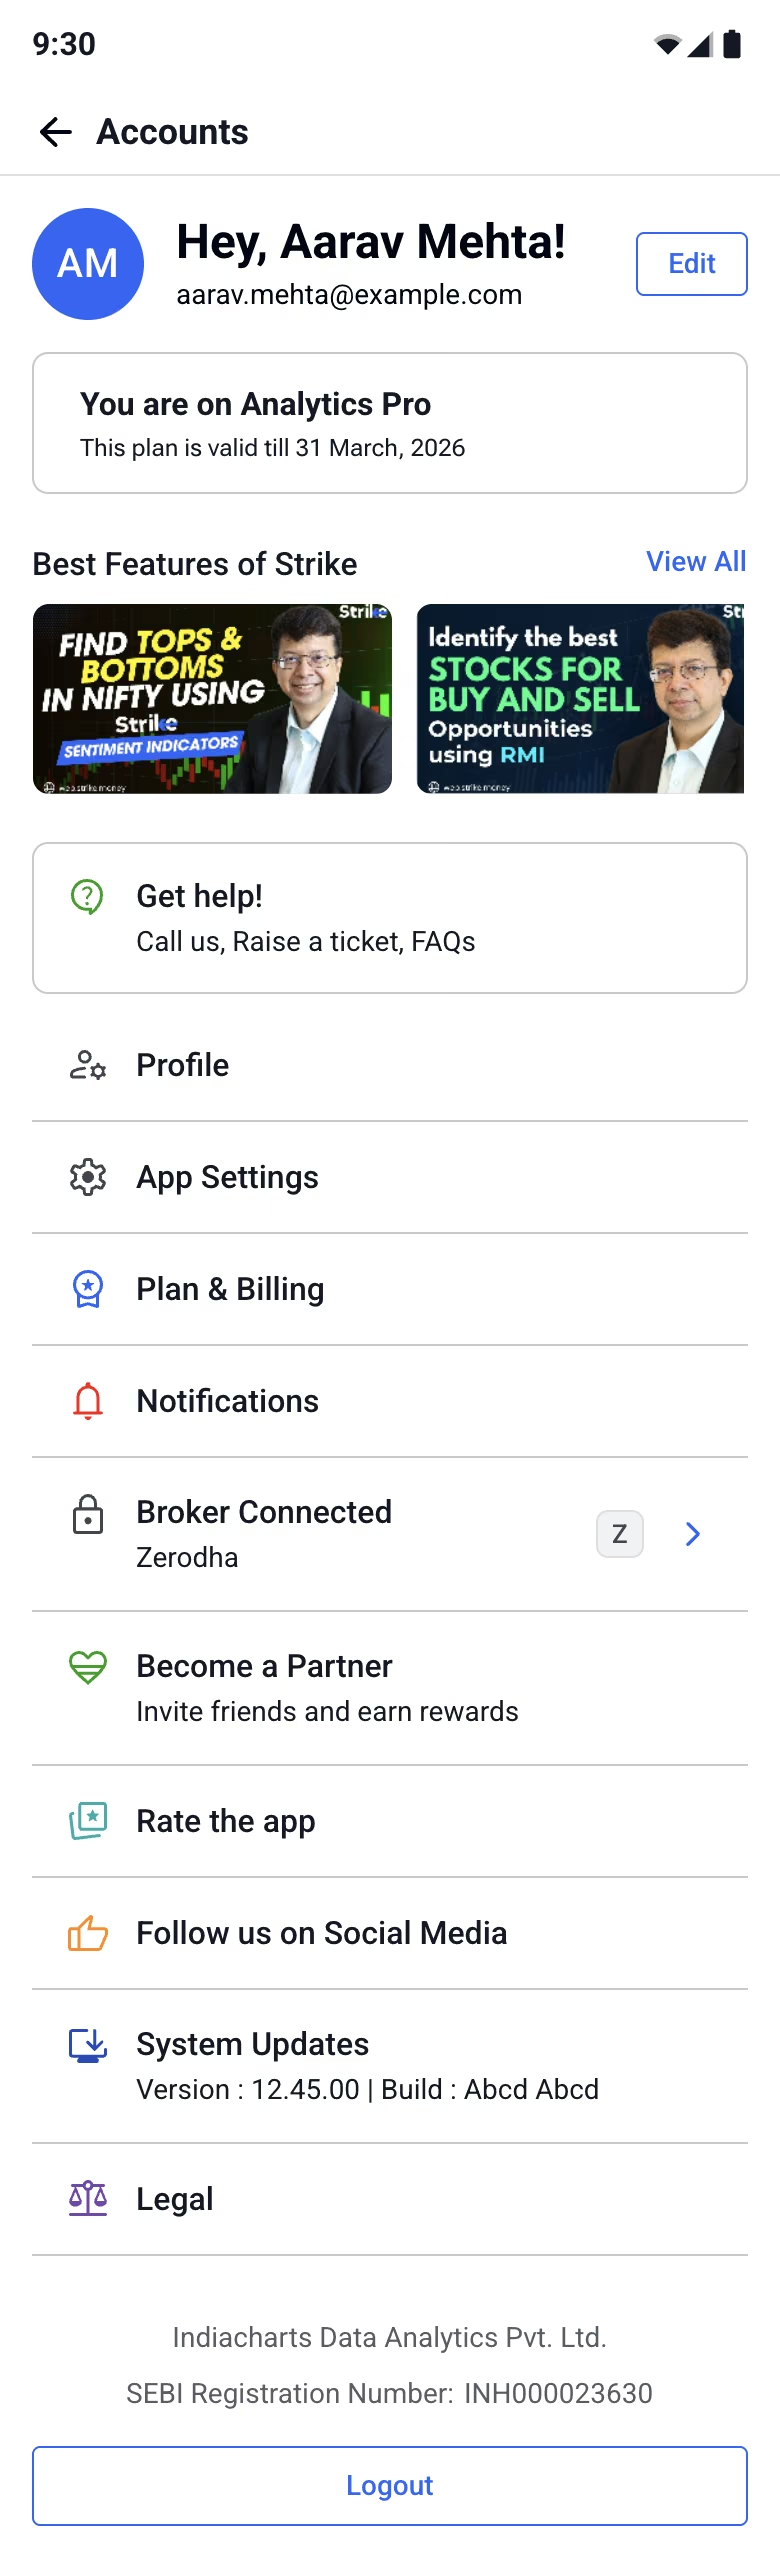
The account screen: current plan, best features, linked broker and settings
AccountPlan, broker link and settings in one list